Underneath the lost kilos – Imaging insights to understand weight loss in clinical trials
By Lars Johansson, Chief Scientific Officer Published: 21 Jan 2026
The obesity drug development landscape is at a turning point. Regulatory approvals and clinical breakthroughs have accelerated innovation. But the race is no longer only about who can deliver the greatest weight loss. It’s about who can prove meaningful, lasting health impact.
As competition intensifies, success will hinge on answering deeper questions:
- Where does weight loss occur? How does it affect muscle quality, organ health, metabolic resilience and physical function?
- Traditional metrics like kilograms and BMI tell only part of the story. The next era of obesity trials demands evidence that goes underneath the lost kilos, evidence that differentiates therapies, informs regulators, and ultimately transforms patient outcomes.
- Advanced imaging is a key to unlocking these insights. By integrating body and muscle composition measures with organ-level biomarkers and physical function, the field can move beyond superficial endpoints and reveal the true quality of weight loss.
This is not just science, it’s a strategy for the future of obesity treatment.
Capturing weight loss and body composition in clinical trials
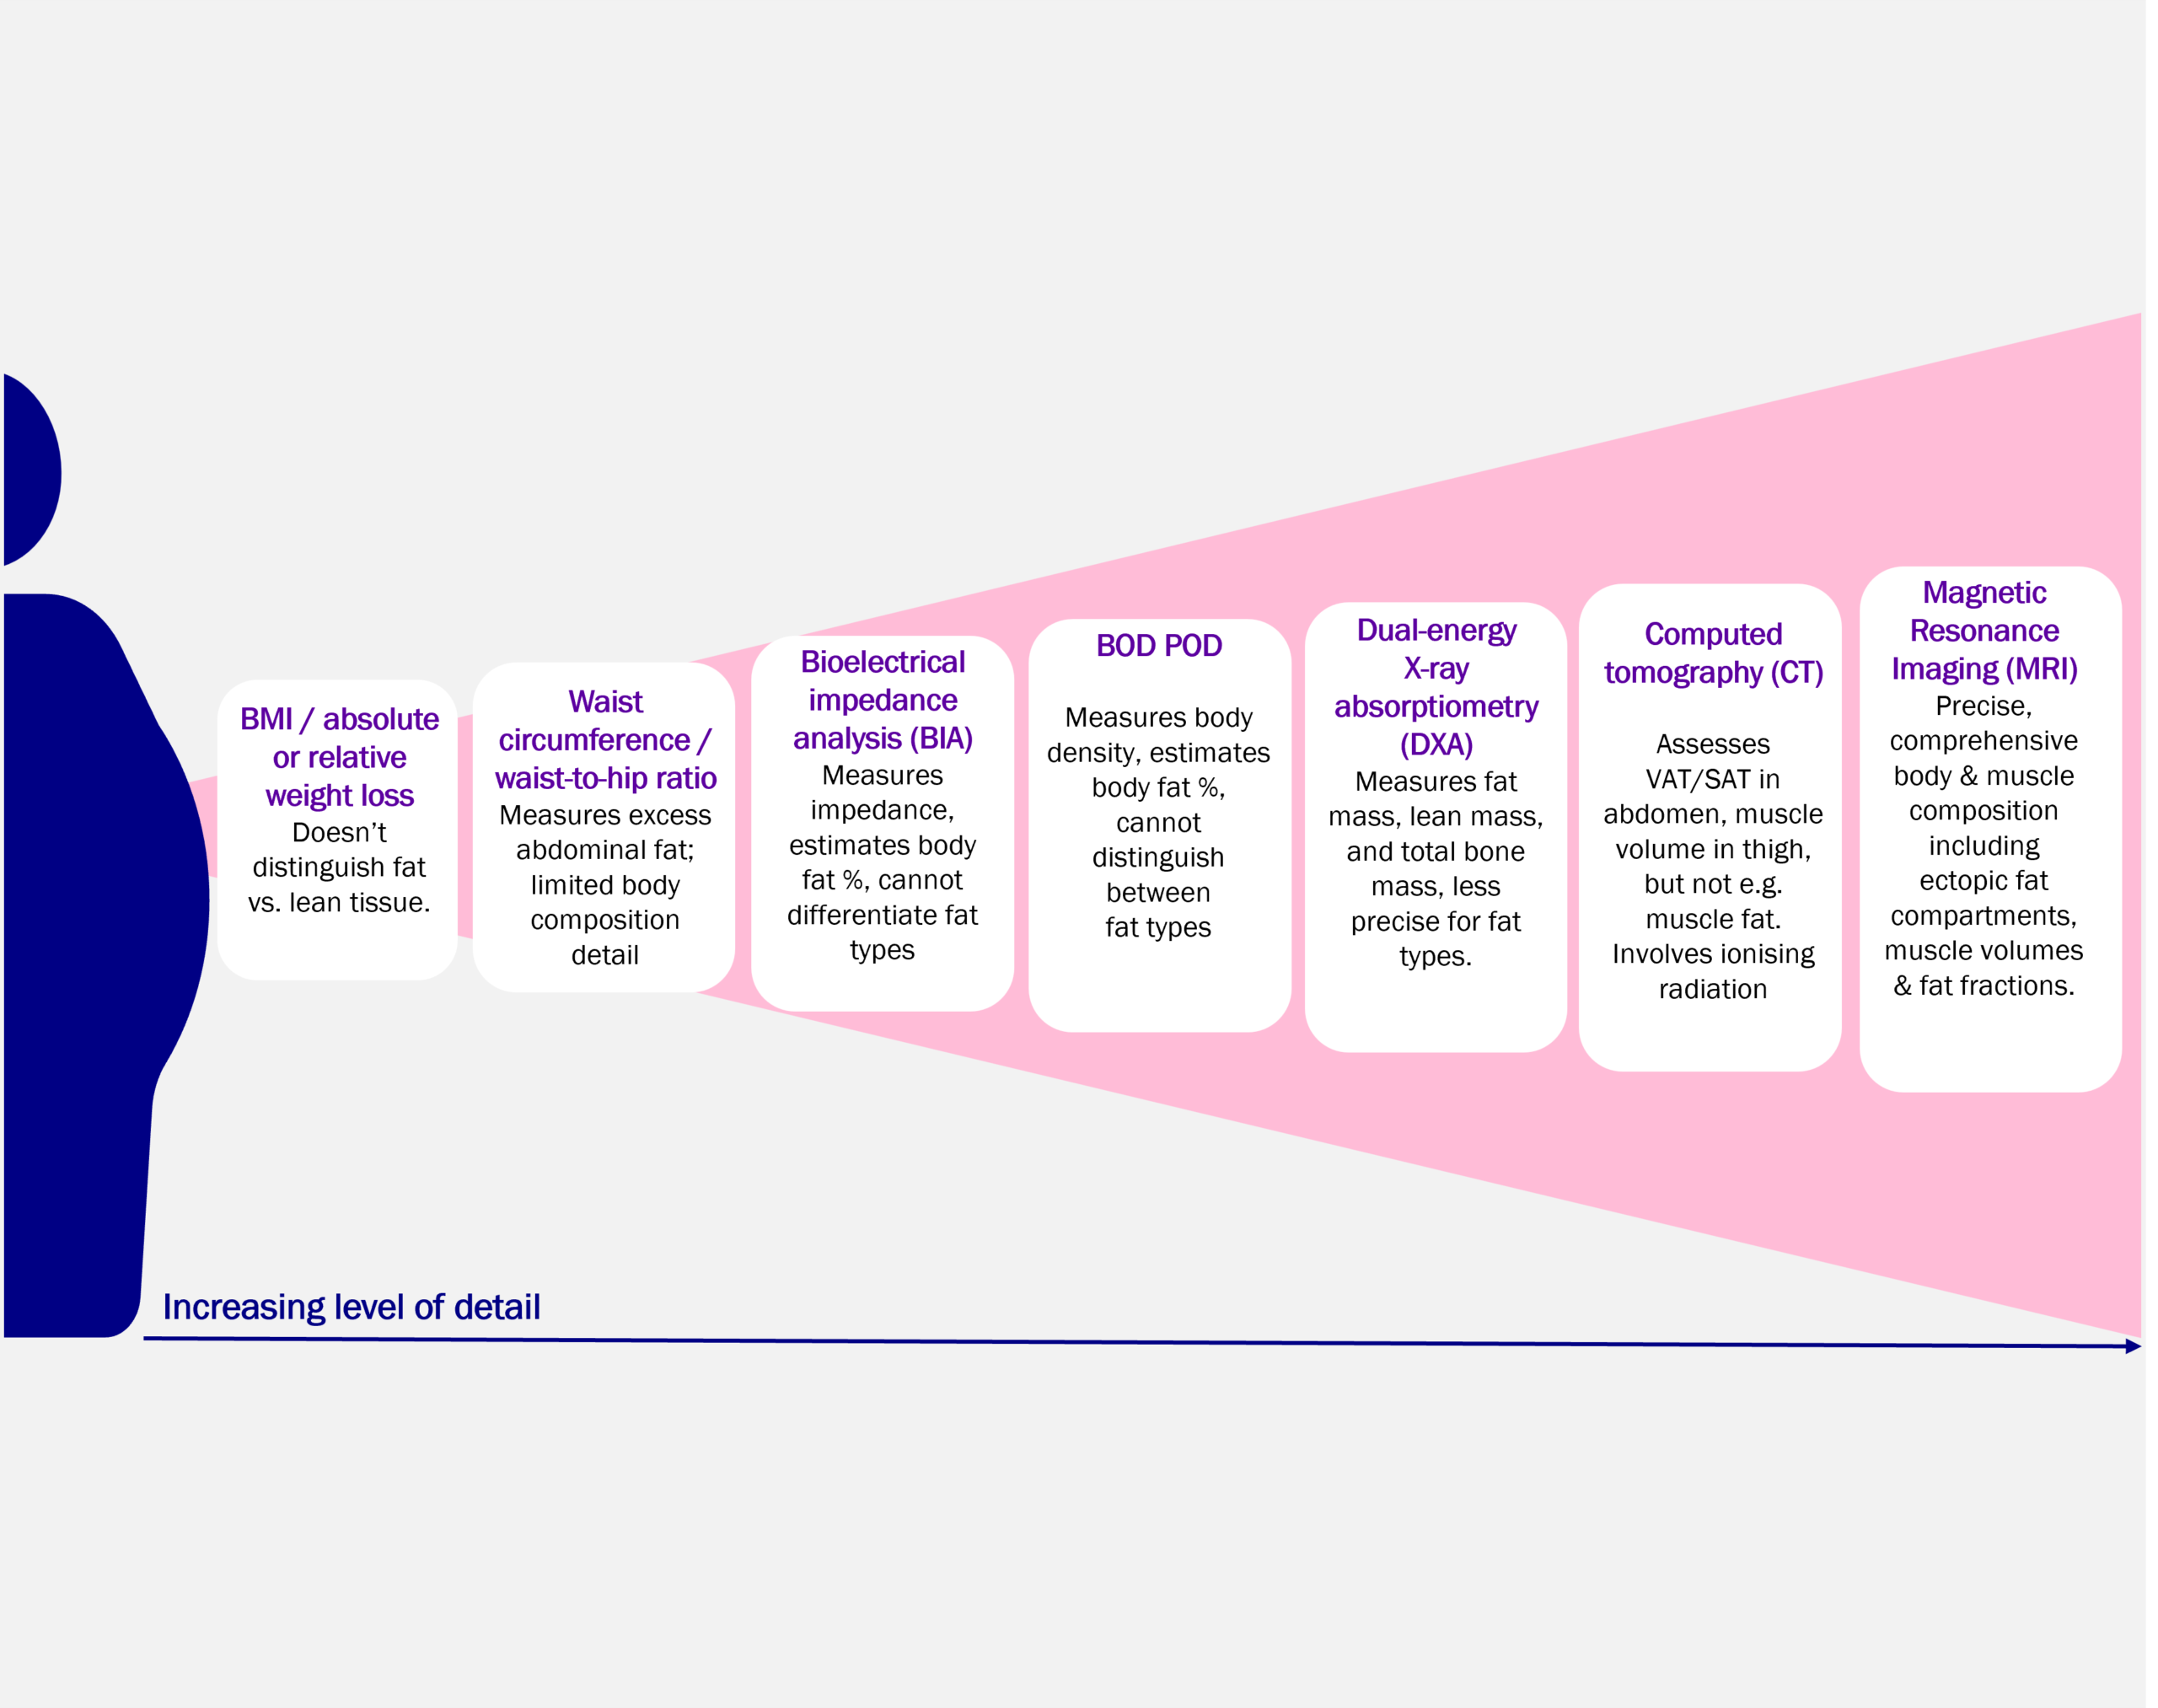
It’s important to understand the different approaches to assessing weight loss and body composition to design robust trials and generate meaningful evidence. Several methods are available (Figure 1), each offering different levels of detail. At Antaros Medical, we apply DXA (Dual-energy X-ray Absorptiometry), CT (Computed Tomography), and MRI (Magnetic Resonance Imaging) to investigate changes in body and muscle composition.
When deeper insights are needed to link tissue volumes to functional imaging readouts, such as mitochondrial function and tissue-specific insulin sensitivity, we apply modalities like MRS (Magnetic Resonance Spectroscopy) and PET (Positron Emission Tomography) (Figure 2).
The choice of imaging method should be guided by your development phase and the key research questions you aim to answer. This article will guide you through key imaging modalities for body and muscle composition as well as functional imaging readouts, highlighting how each can support your trial objectives.

Body compostion imaging
DXA: A practical choice for large-scale studies
DXA is a fast, accessible, and cost-effective imaging method, making it particularly well-suited for large-scale clinical trials. It provides reliable estimates of total fat and lean mass, offering a solid foundation for assessing body composition changes over time. When the goal is to monitor general changes rather than highly detailed tissue characterization, DXA is the method of choice.
CT: A smart add-on for body composition
Computed Tomography (CT) can be a practical option for body composition analysis when it is already part of the trial protocol, for example, in studies focused on heart, lung, or oncology indications. The method involves ionizing radiation, but leveraging existing CT scans avoids additional imaging sessions and patient burden while providing valuable insights into fat and muscle distribution. This approach maximizes the utility of collected data without increasing trial complexity.
MRI: A precise and comprehensive view of body composition
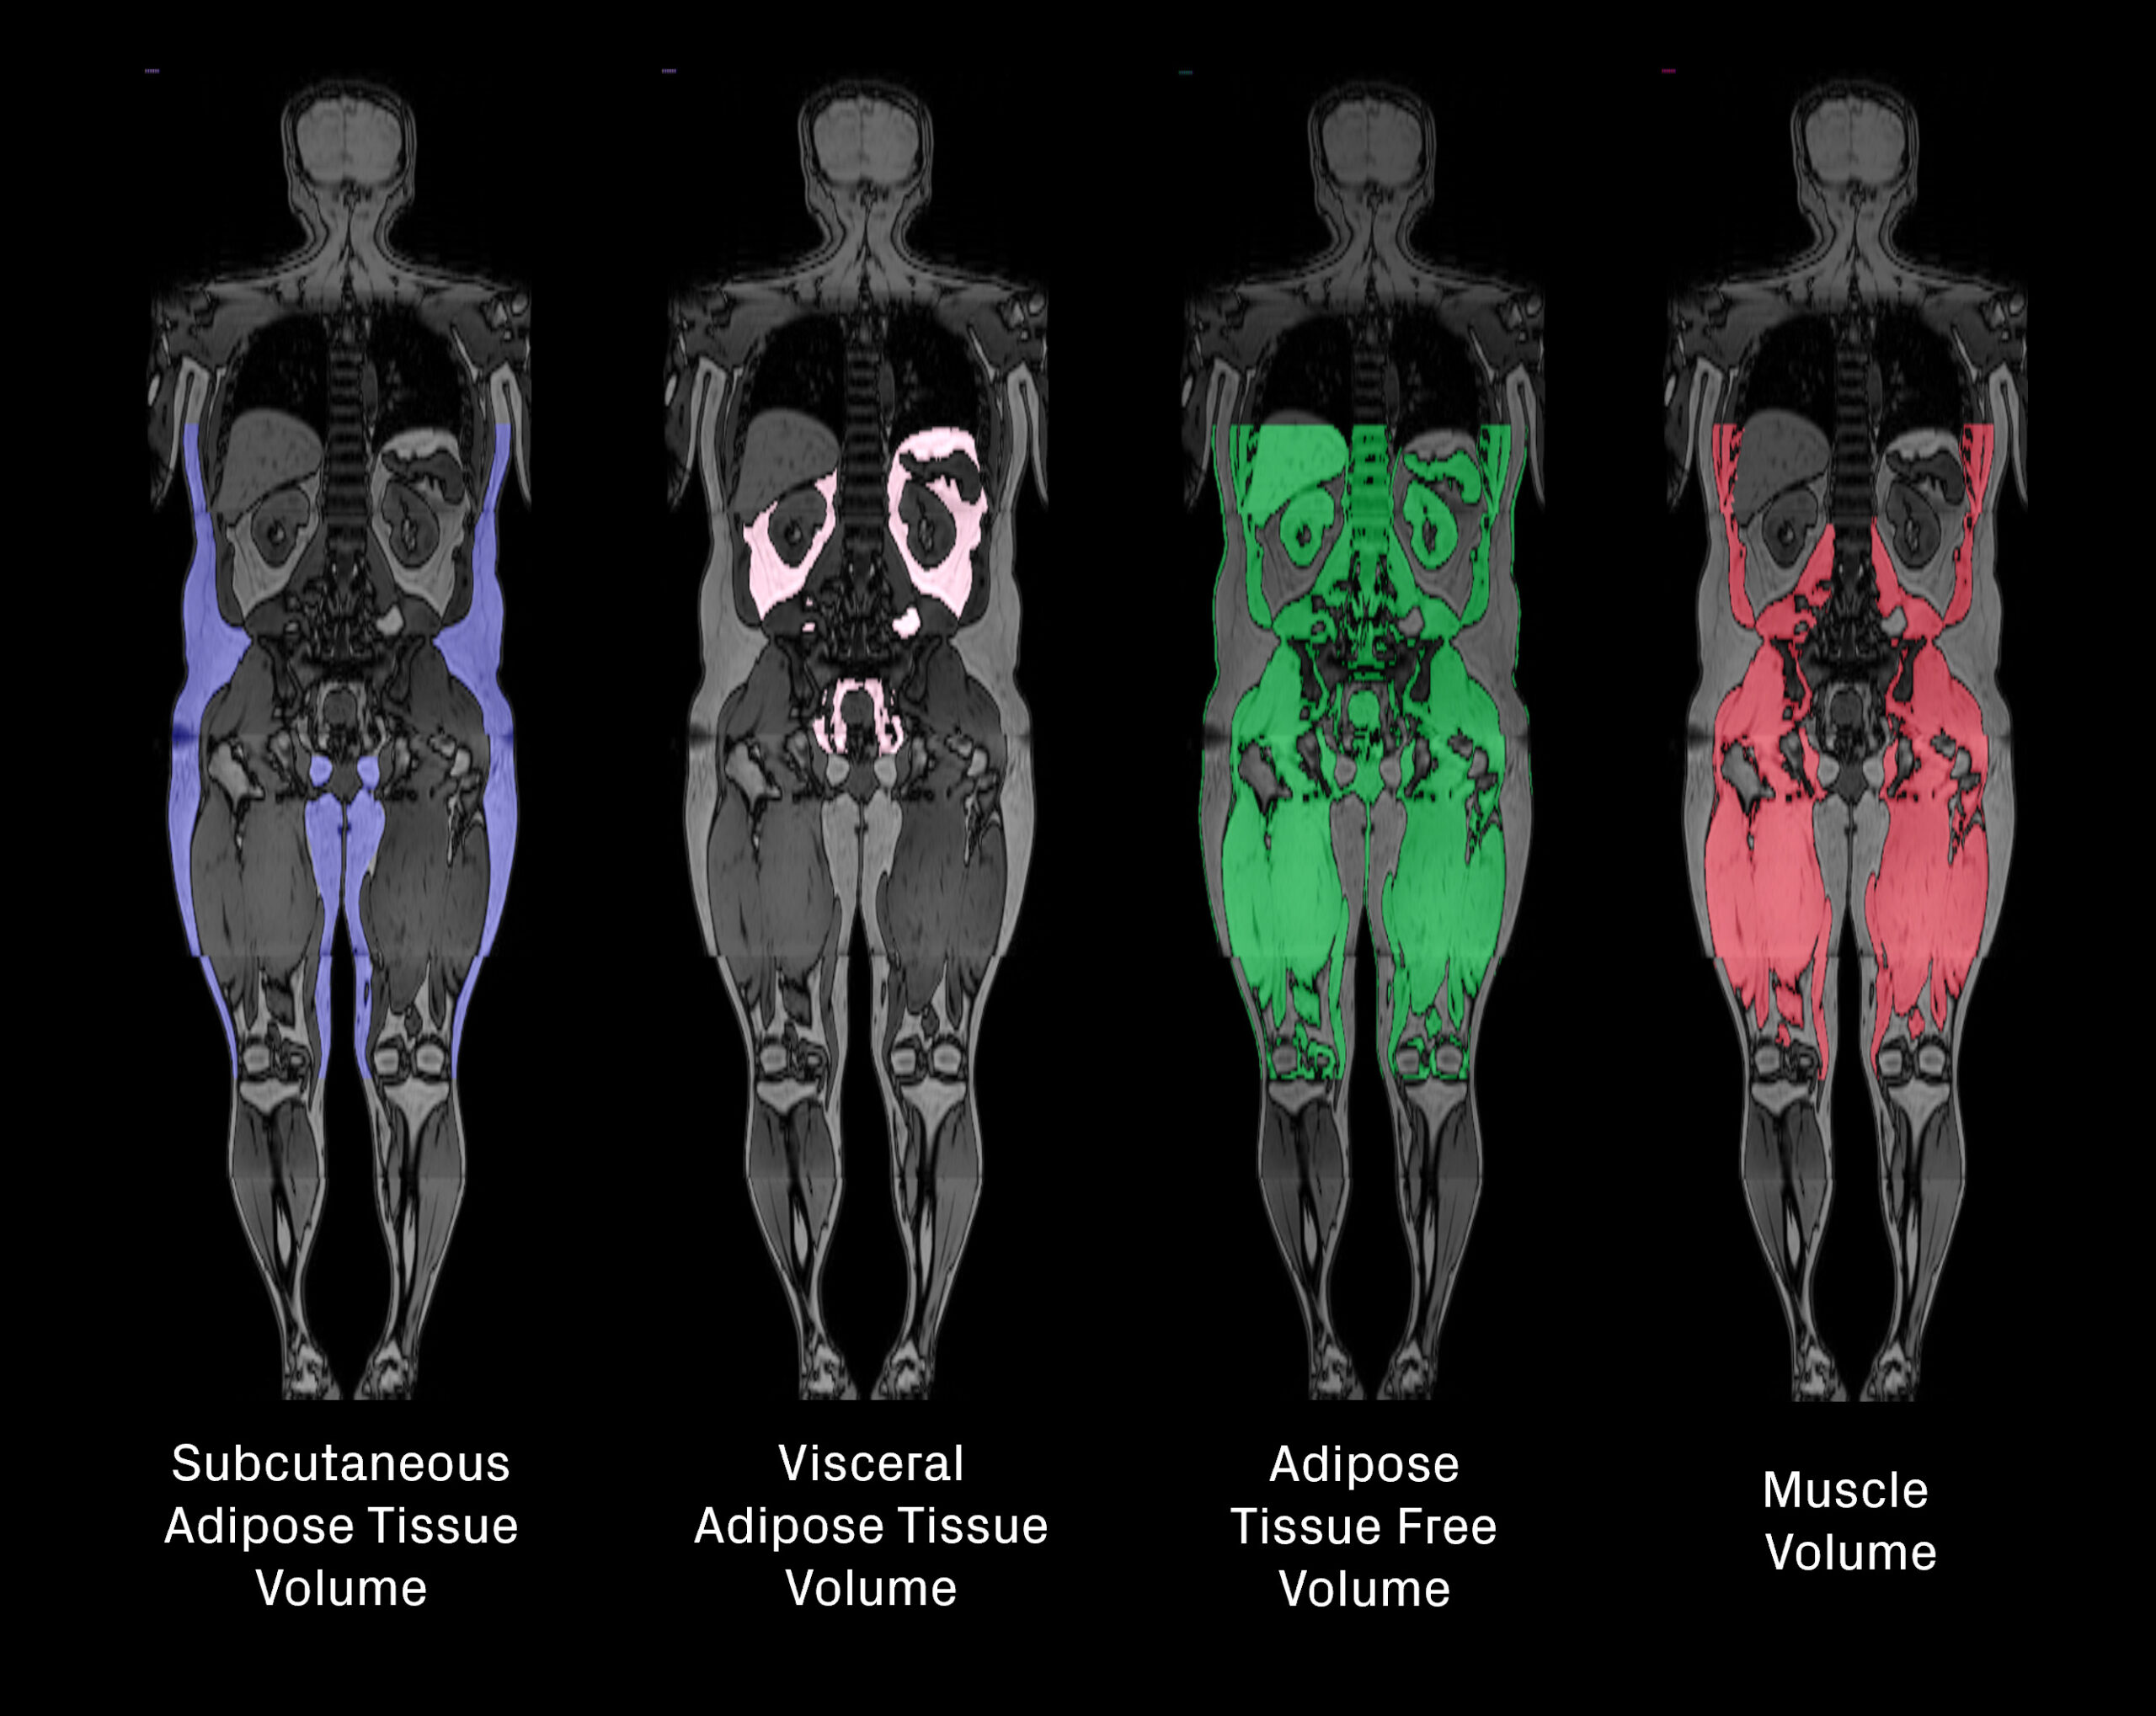
MRI provides a detailed volumetric assessment of fat and lean tissue by quantifying visceral adipose tissue (VAT), subcutaneous adipose tissue (SAT), adipose tissue-free volume and skeletal muscle volume from whole-body images (Figure 3). This enables a deeper understanding of where weight loss originates, often referred to as the “quality” of weight loss. Beyond overall fat and lean volumes, MRI can also reveal changes in specific ectopic fat depots in and around organs such as the liver, kidney, muscle, heart, and pancreas (Figure 4).
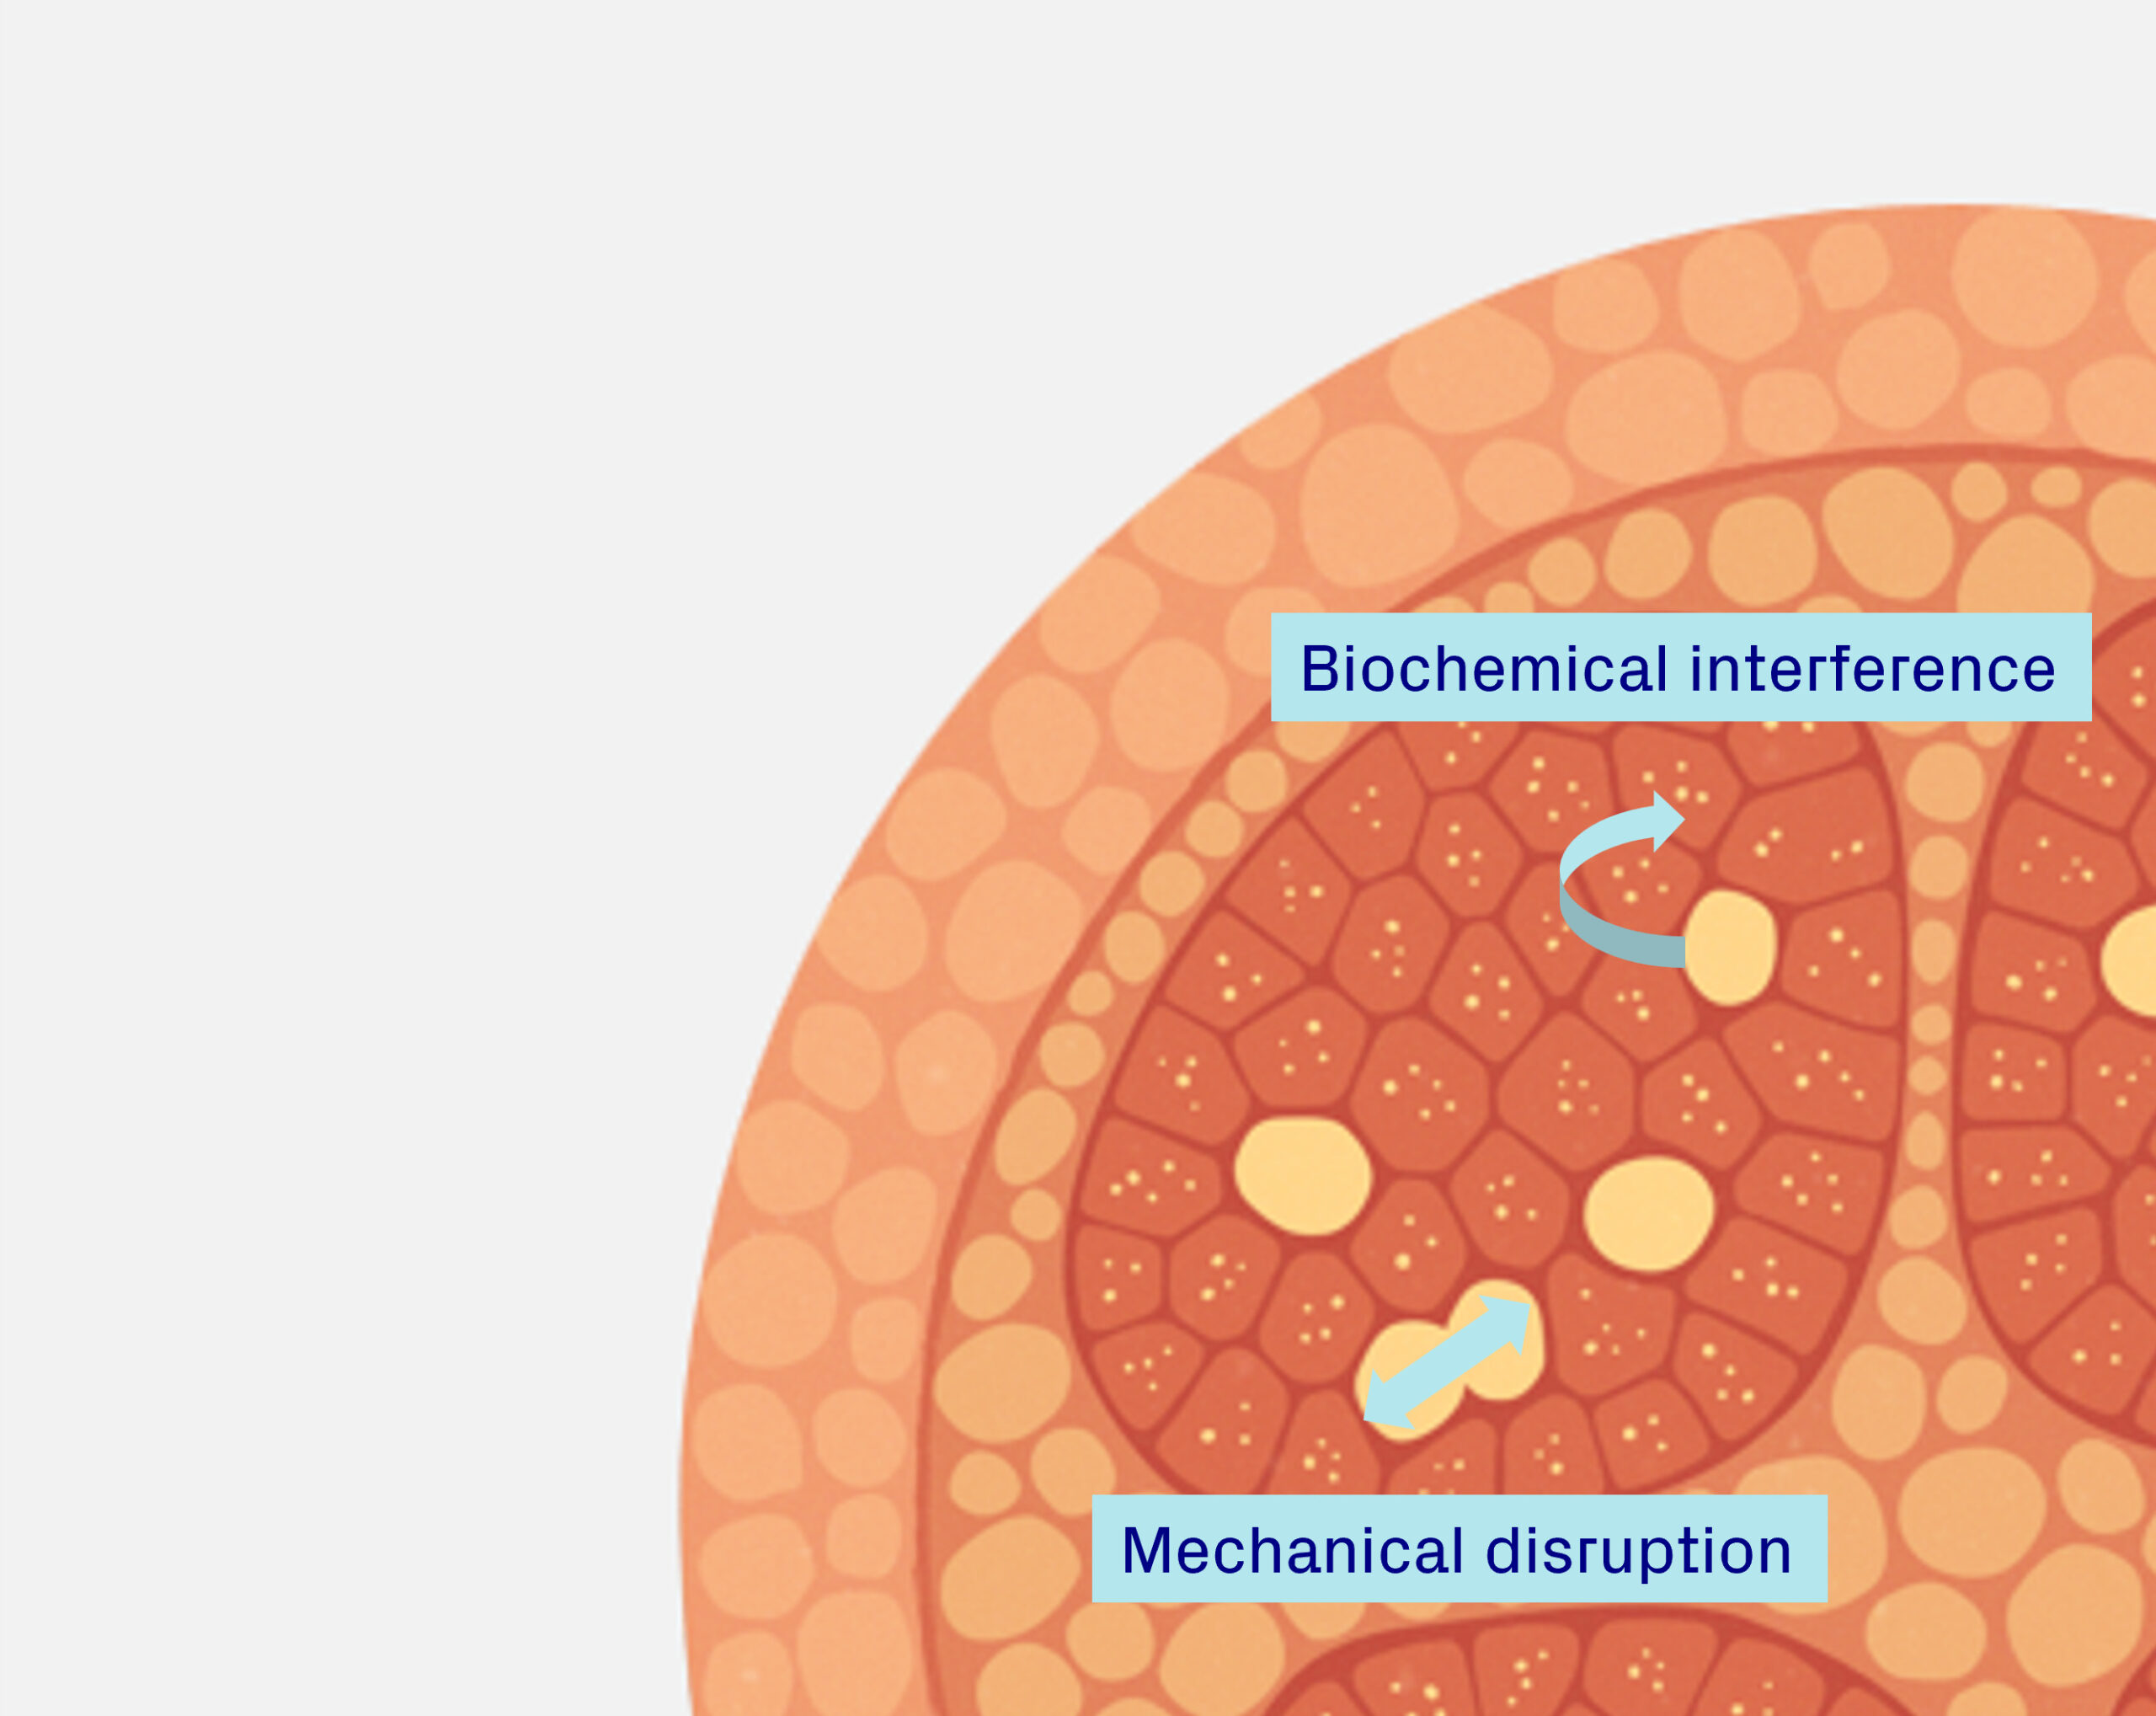
Ectopic fat is increasingly recognized as a contributor to metabolic dysfunction and systemic inflammation, playing a role in insulin resistance, cardiovascular risk, and organ impairment. In addition, fat accumulation in certain locations, such as around the heart, within muscle, or surrounding the kidneys, may exert mechanical stress that compromises organ function and physical performance. Tracking these changes provides insight into both the metabolic and functional consequences of weight loss [1-3].

Muscle composition imaging
Muscle composition and fat compartments in weight loss
Understanding muscle composition is critical for interpreting treatment effects accurately. For example, loss of muscle fat should not be mistaken for loss of muscle volume, and preserving muscle volume should not be misinterpreted as lack of weight-loss efficacy.
Further, specific muscle composition changes can influence metabolic health, physical function, and the overall quality of weight reduction. To gain a complete picture, it is important to distinguish between different types of fat located within and around muscles.
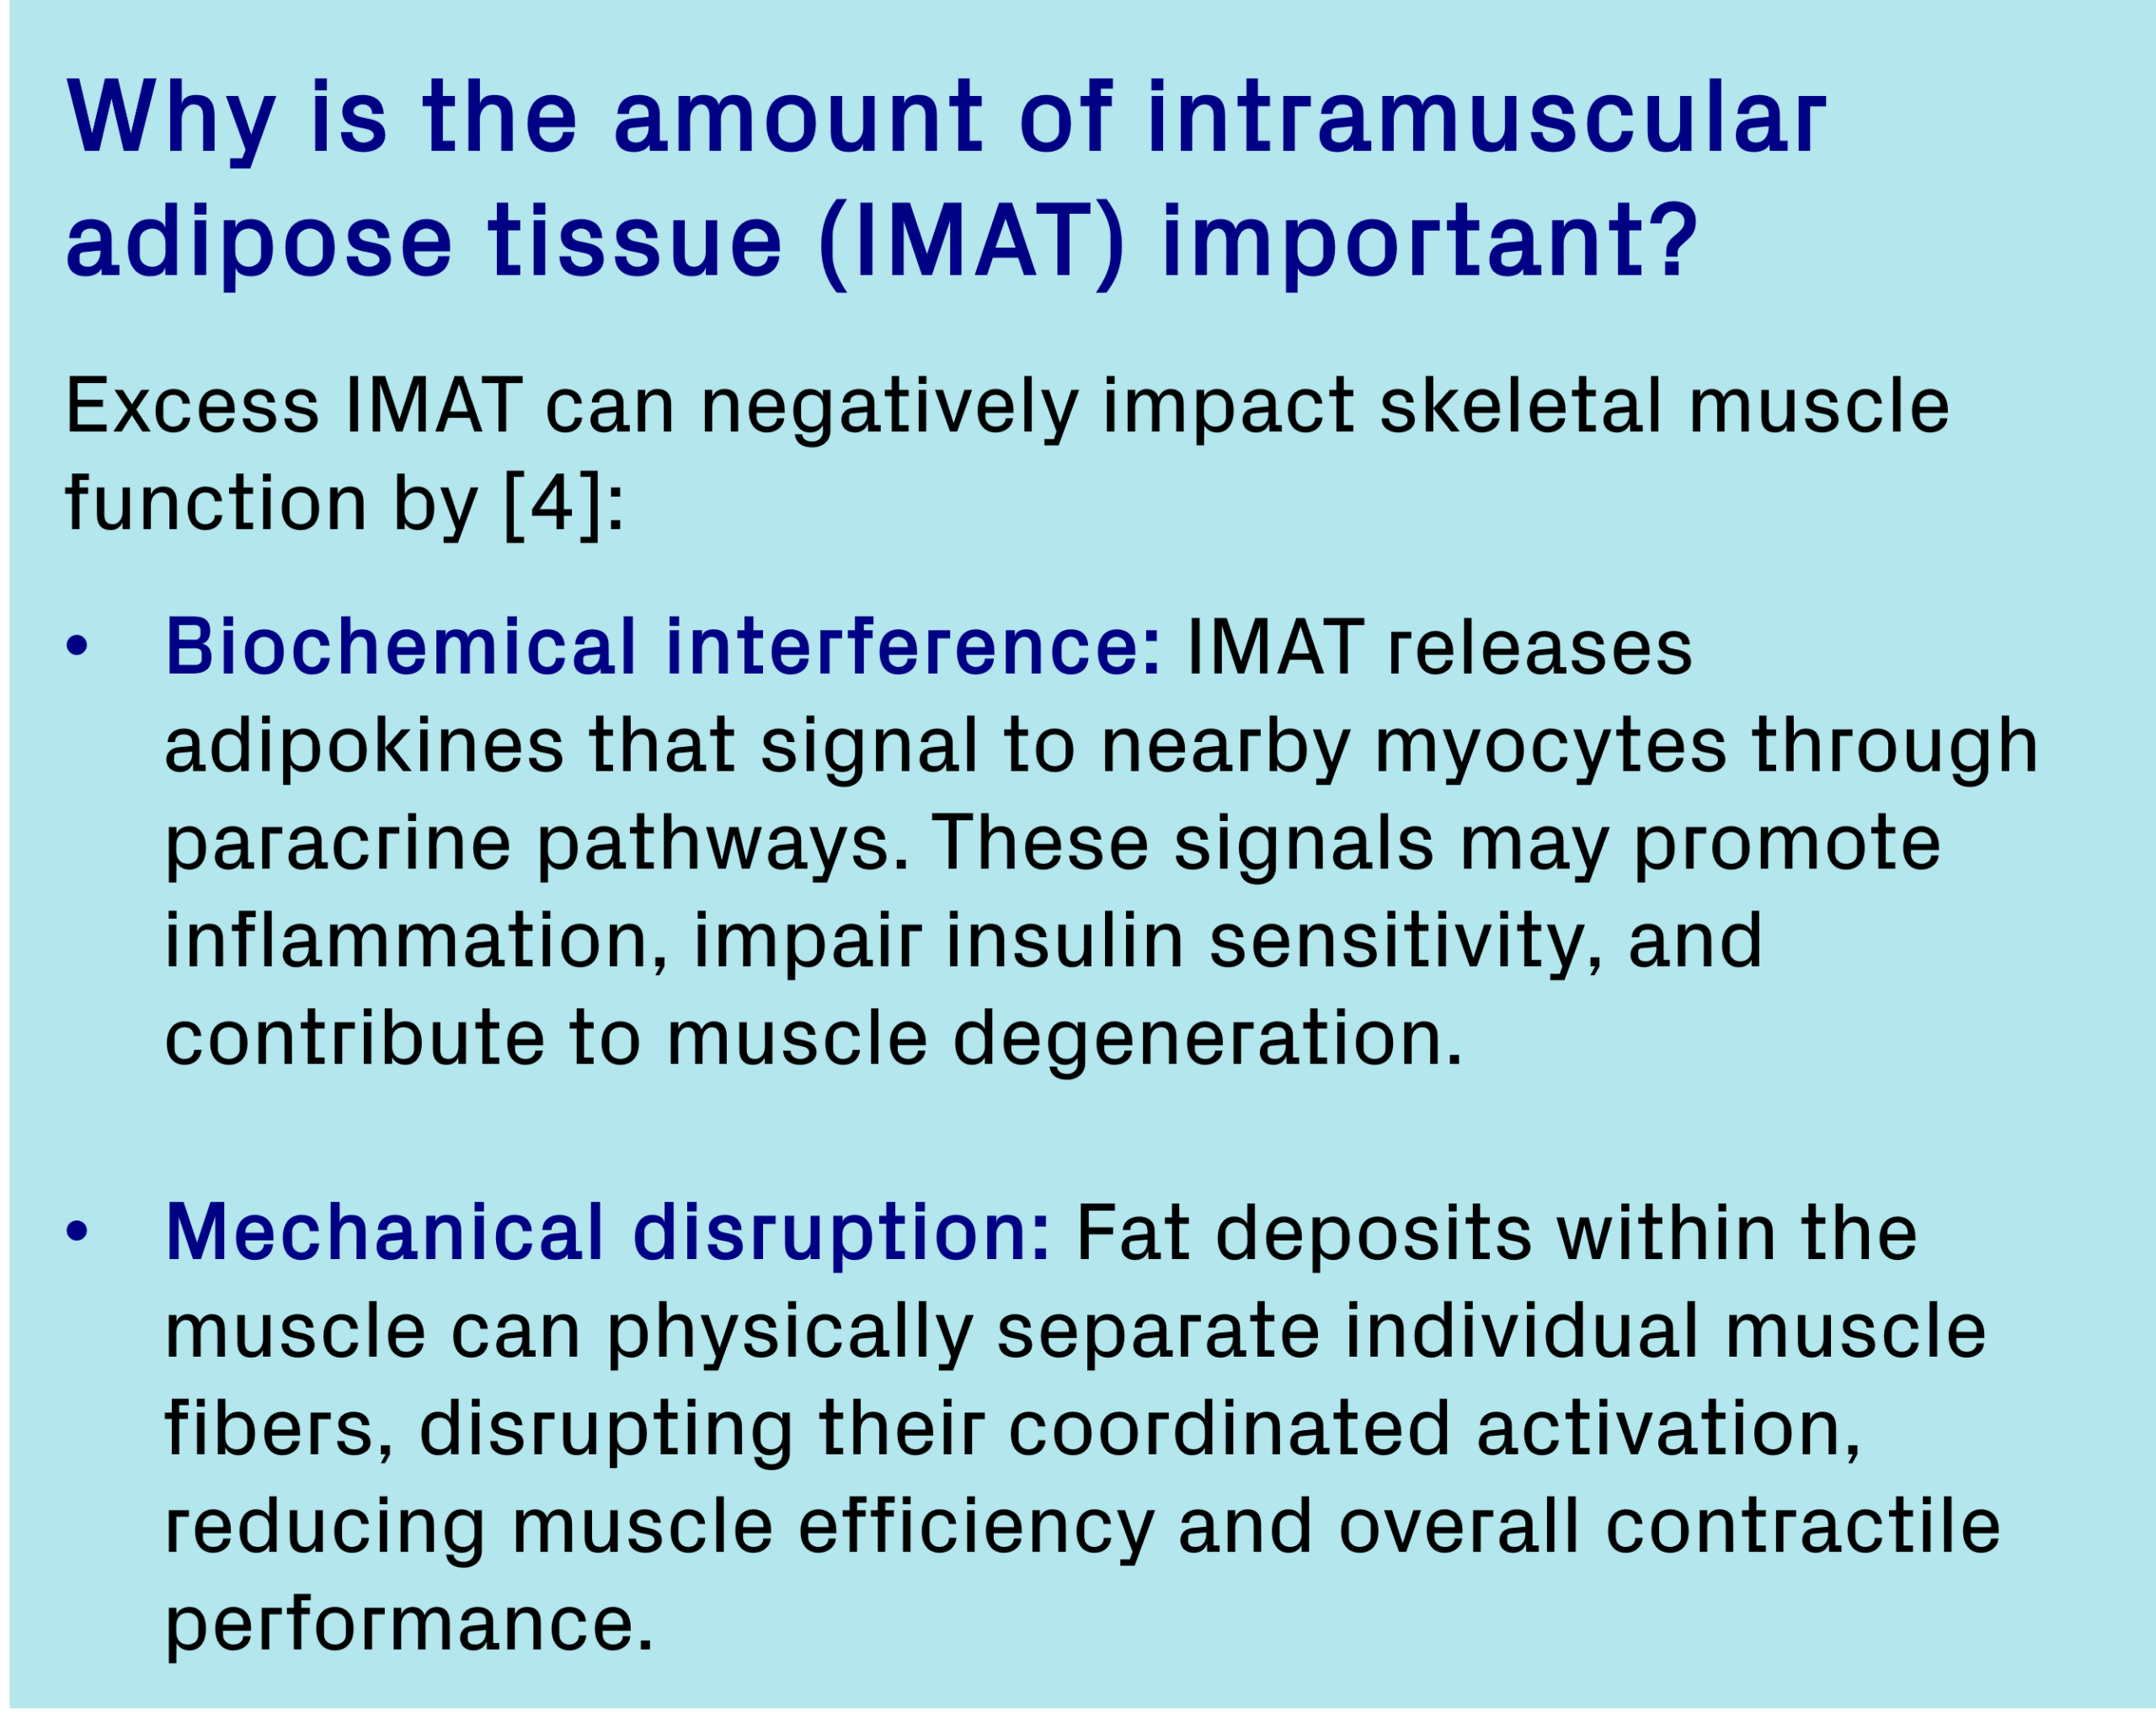
Fat associated with muscle can be categorized into distinct compartments (Figure 5) [4]:
- Intramuscular adipose tissue (intra-MAT): Fat located within muscle, expressed as volume or fat fraction. It includes fat between muscle fibers and fascicles, within the epimysium.
- Intermuscular adipose tissue (inter-MAT): Fat surrounding muscles beneath the deep fascial layer, outside the epimysium but between adjacent muscles.
- Intramyocellular lipids (IMCL): Lipid droplets stored inside muscle cells, serving as an energy source but also associated with metabolic dysfunction when elevated.
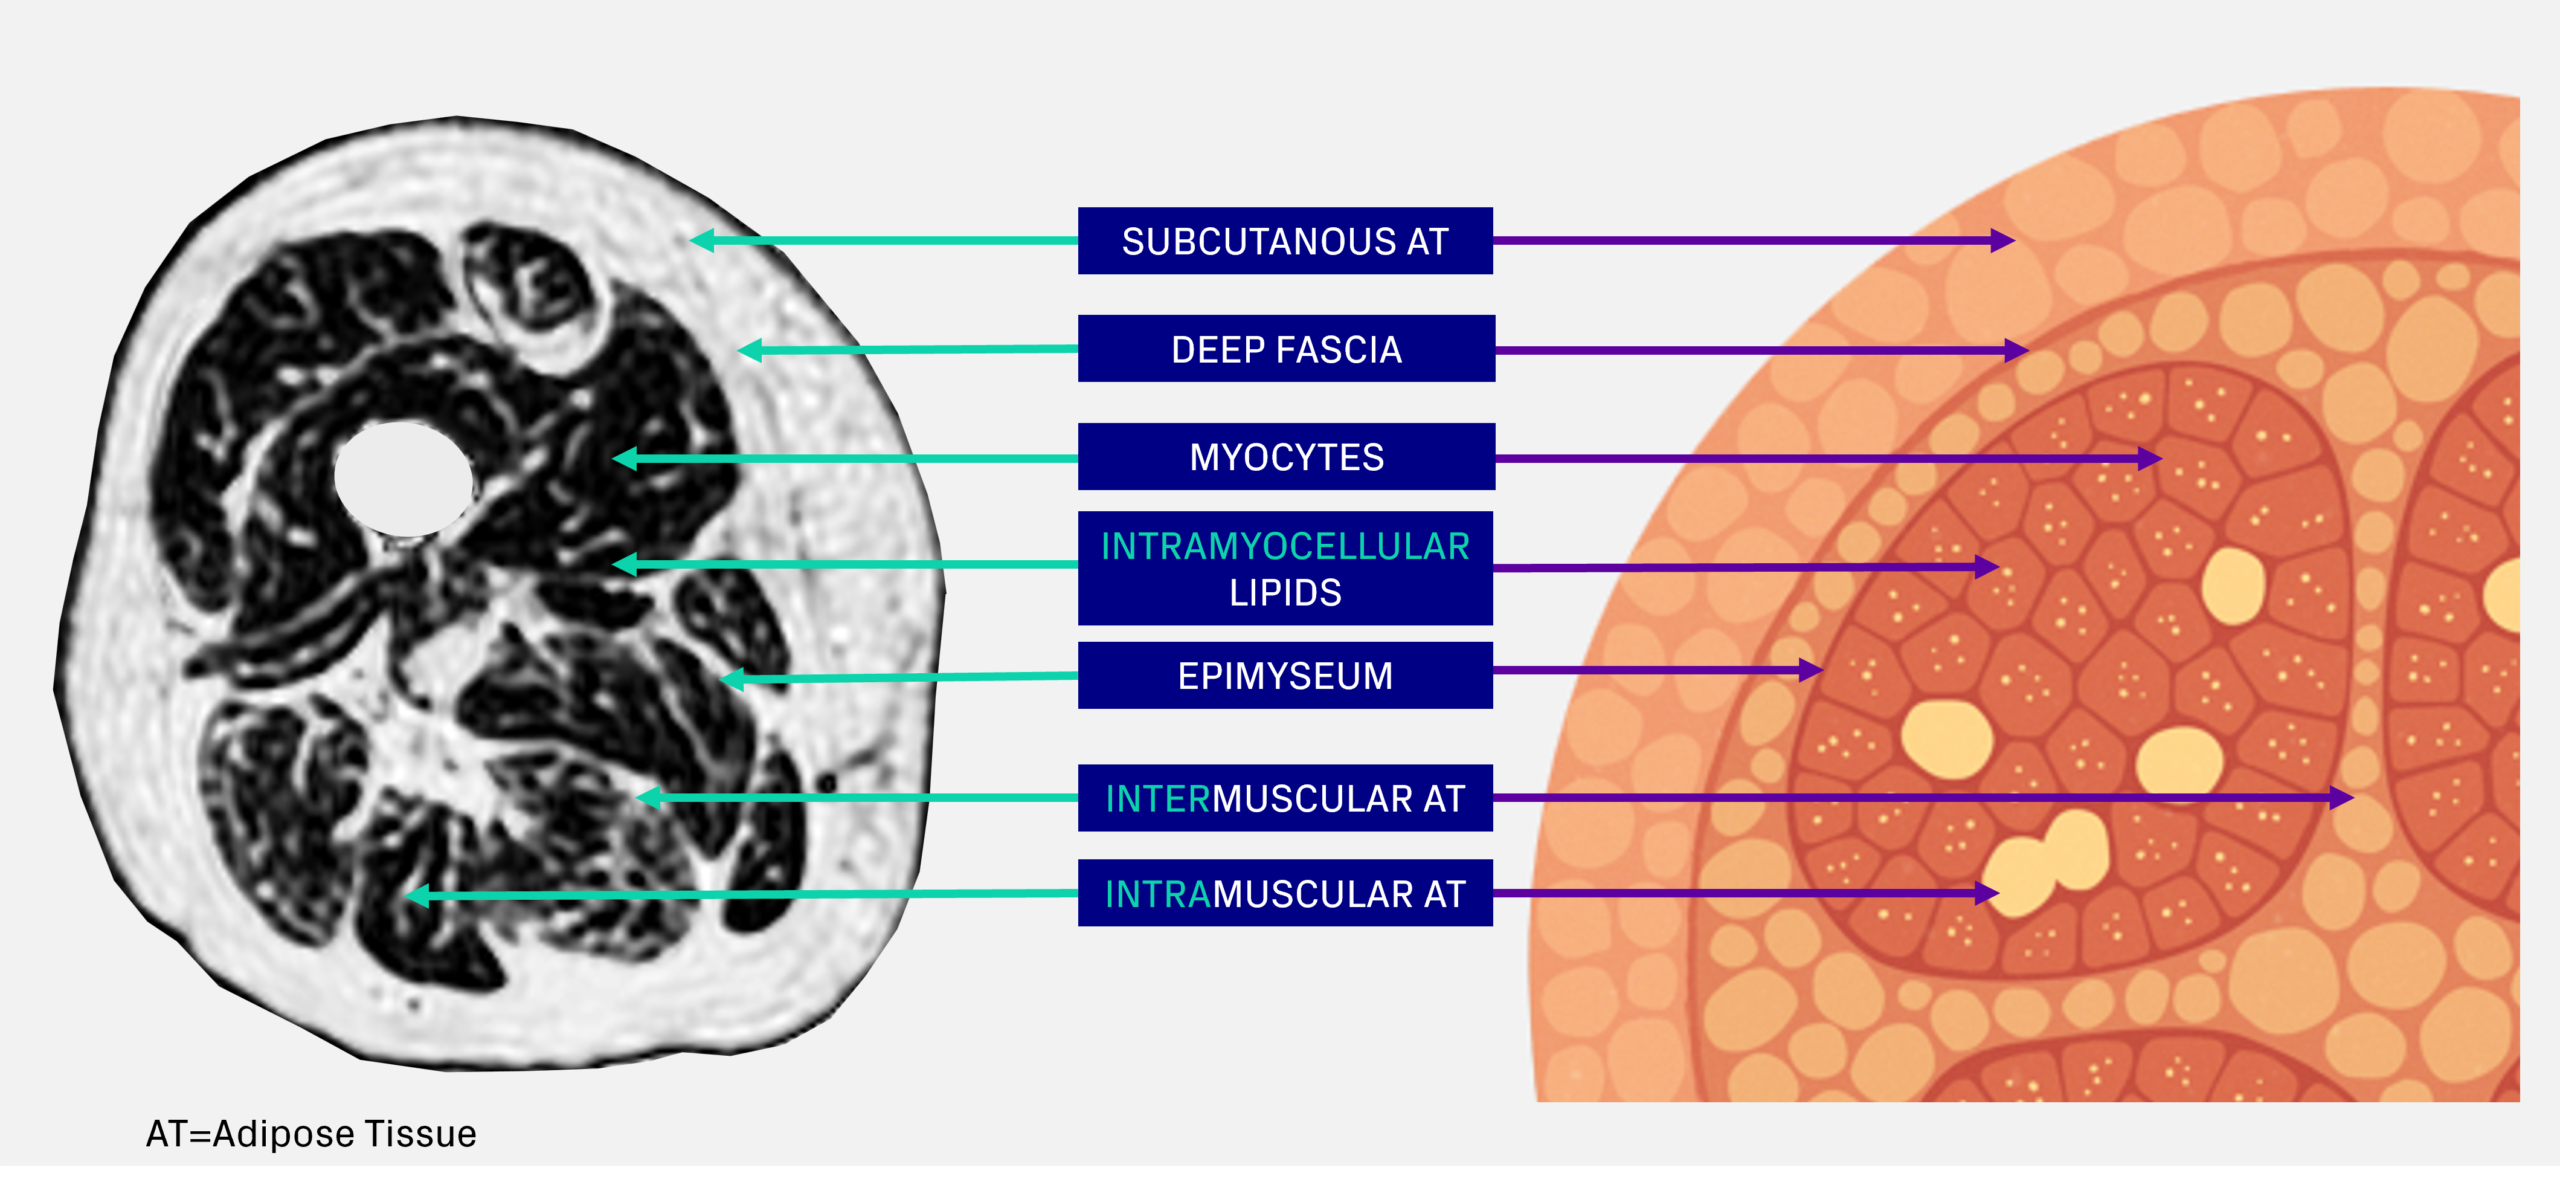
Figure 5. Thigh muscle anatomy and definitions of muscle fat
MRI-based muscle volume and composition analysis
MRI enables advanced muscle composition measurements with exceptional granularity and precision. Beyond muscle volume, MRI can distinguish between the different muscle fat components. It even offers the opportunity to analyze individual muscle groups and their compartments separately.
There are several approaches to measuring muscle composition with MRI. At Antaros Medical, we quantify all adipose tissue within and around the muscle (inter- and intra-MAT) for a complete picture. Measuring all fat is important in interventional trials where changes over time matter and specificity become critical. Precise and accurate measurements ensure that observed differences reflect true physiological changes rather than methodological variation, essential for interpreting treatment effects in clinical trials.
To achieve this, we segment all thigh muscles individually (Figure 6), enabling granular insights for each muscle. This detail becomes especially valuable when combining imaging data with functional endpoints.
Figure 6. AI based segmentation of individual thigh muscles
Functional metabolic imaging
MRS: A powerful tool for metabolic insights
Magnetic Resonance Spectroscopy (MRS) provides biochemical insights beyond imaging by separating intramyocellular lipids (IMCL) from extramyocellular lipids (EMCL). IMCL, stored inside muscle cells, is closely linked to insulin sensitivity and metabolic flexibility, making it an important marker in obesity and diabetes research [5-6].
Beyond lipid profiling, MRS measures key metabolites such as phosphocreatine and ATP to assess muscle energy metabolism and oxidative capacity reflecting mitochondrial function, offering valuable insights into metabolic flexibility and mitochondrial health in obesity and diabetes [7-8].
PET: A view of substrate utilization and insulin sensitivity
Positron Emission Tomography (PET) provides quantitative insights into whole-body metabolism during weight loss. Using tracers such as 18F-fluorodeoxyglucose (FDG) for glucose uptake and 18F-fluoro-thiaheptadecanoic acid (FTHA) for fatty acid uptake, PET measures substrate utilization and tissue-specific insulin sensitivity in skeletal muscle, adipose tissue, and liver. These data reveal shifts in fuel preference and regional insulin resistance, offering a powerful tool to understand metabolic flexibility and optimize obesity and diabetes interventions [9].
Integrating body and muscle composition with end-organ and functional assessments for deeper insights
Including body and muscle composition endpoints adds depth to your trial, moving beyond simple weight metrics to show how treatments affect fat and muscle quality. These measures can also be combined with functional assessments, such as strength or work achieved per unit of fat free muscle volume, for a more complete picture of patient outcomes. When paired with imaging biomarkers from key metabolic organs, such as the liver, kidney, and heart, this approach provides a holistic view of efficacy and safety, helping demonstrate long-term health benefits (Figure 7).
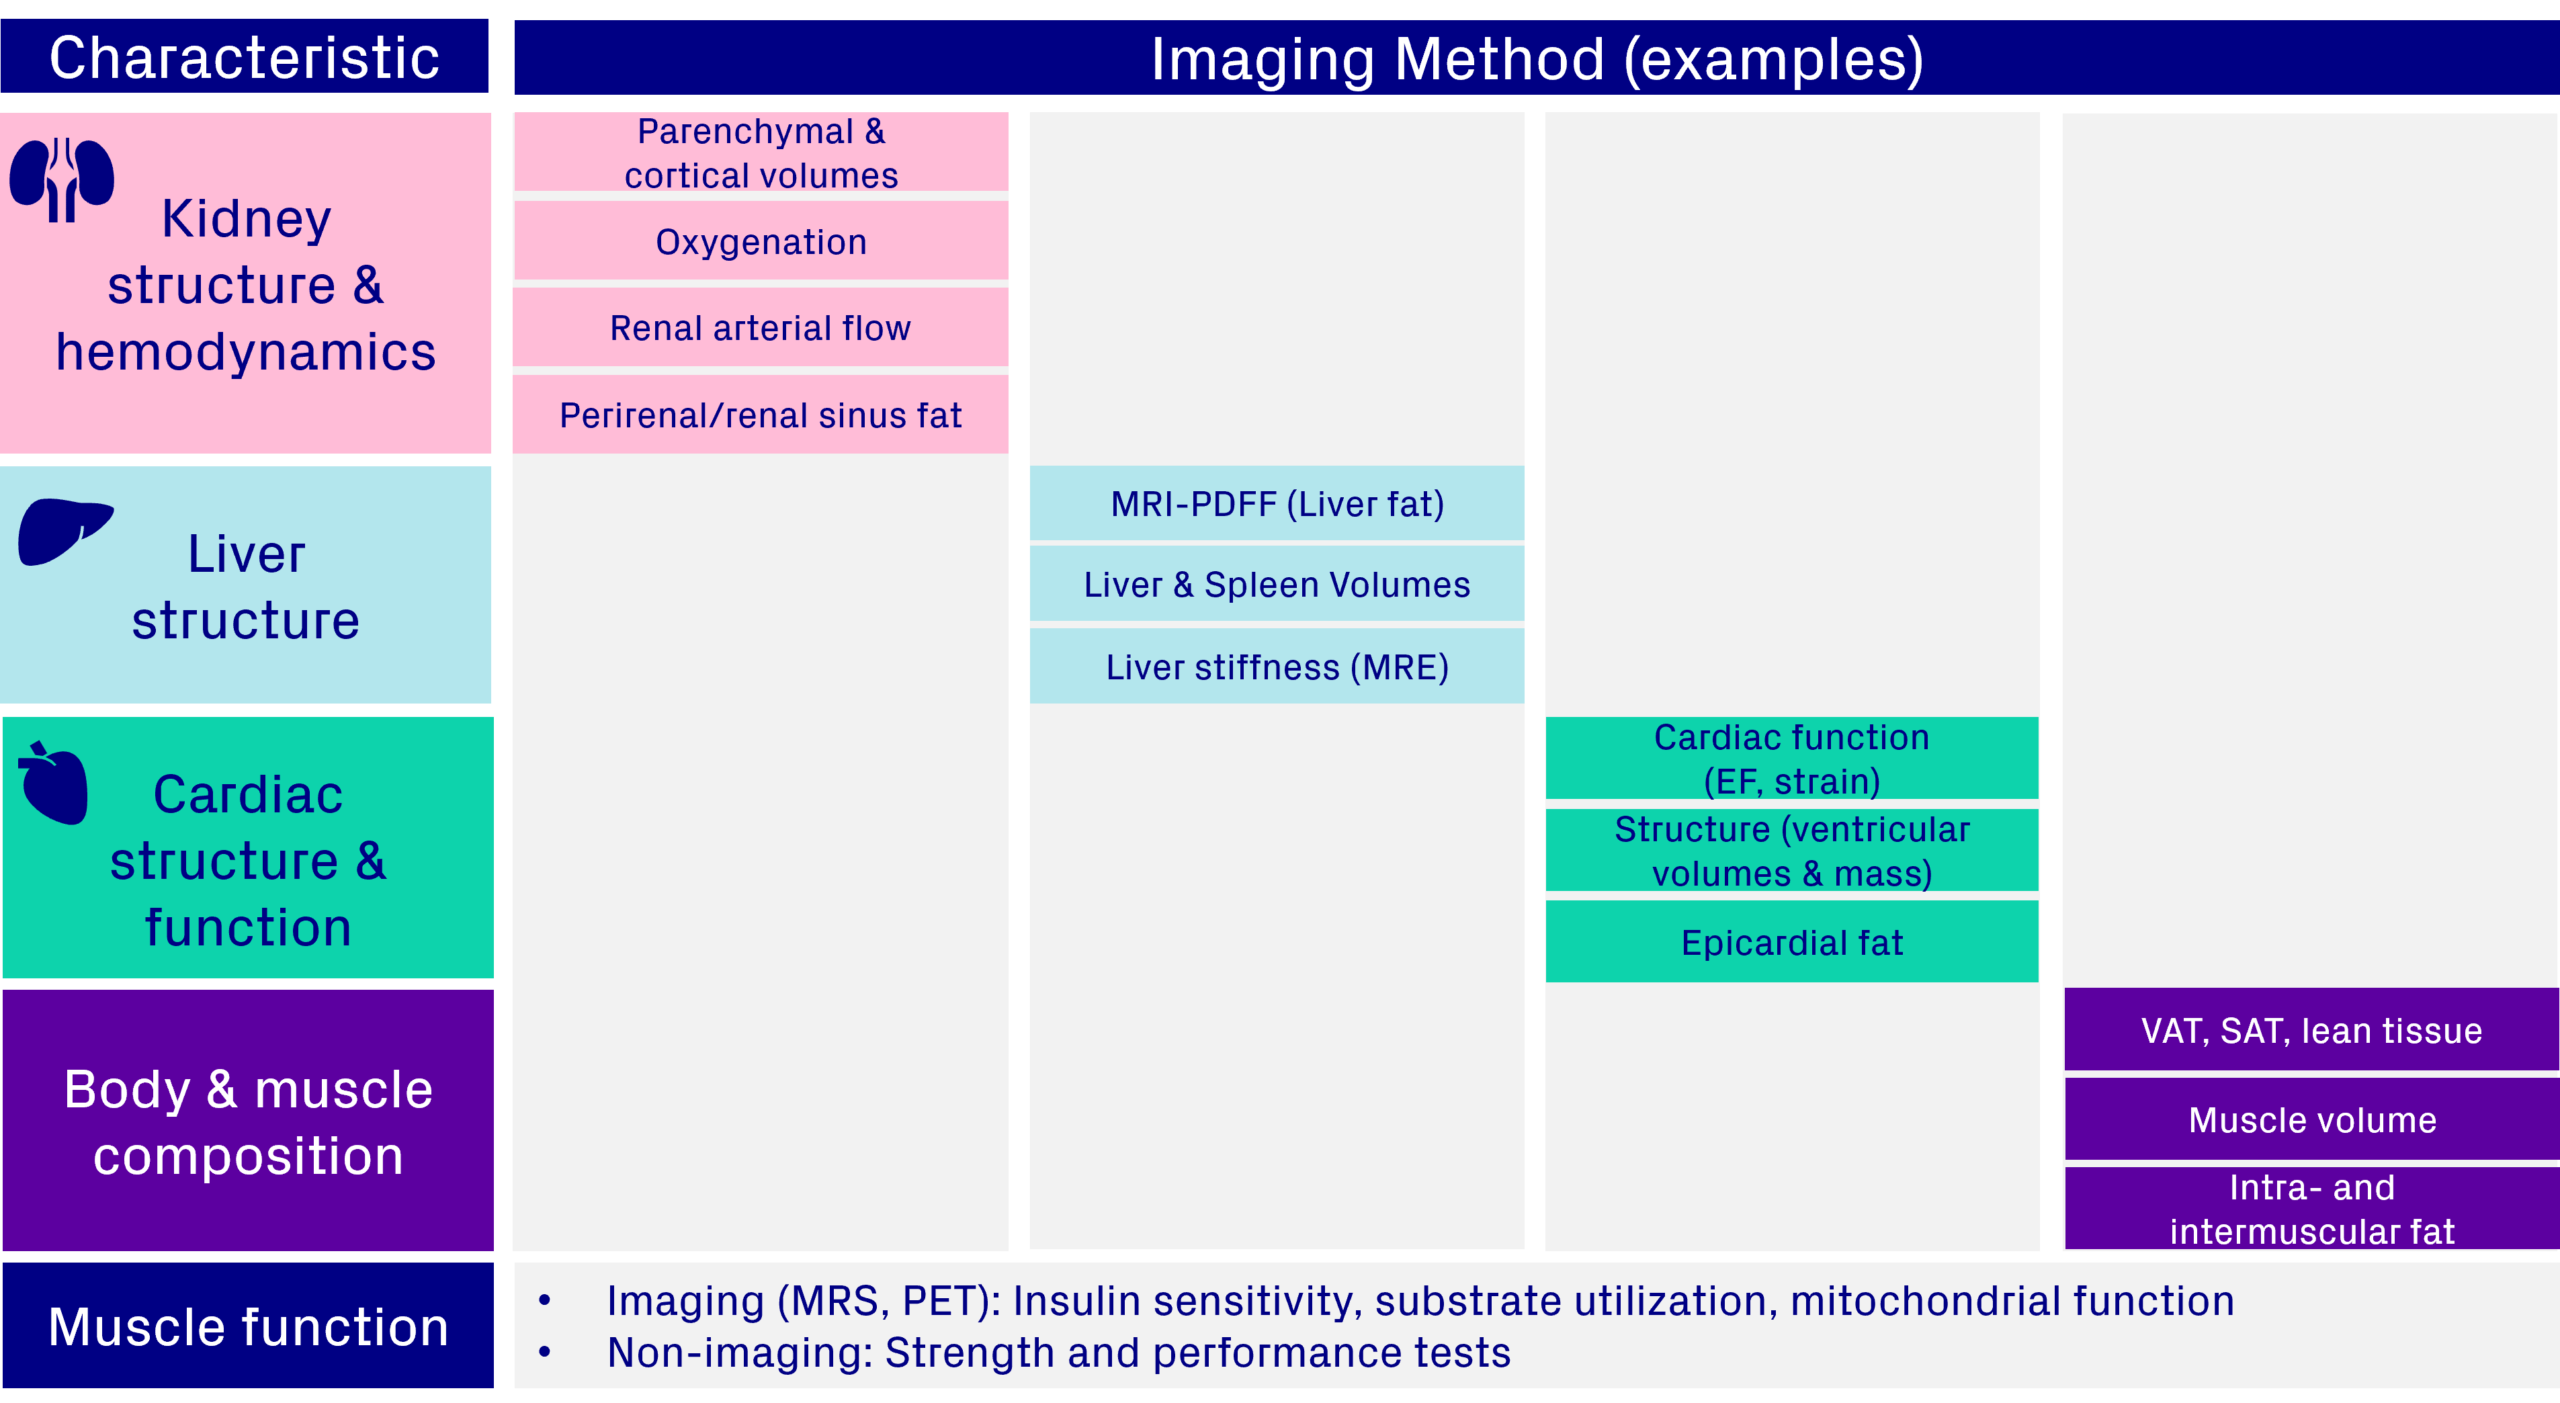
Figure 7. Integrating an imaging protocol to include body and muscle composition measures with other organ effects & muscle function
Regulatory focus beyond weight alone
EMA guidance recommends including body composition measures, such as imaging, as secondary endpoints to help distinguish fat loss from other changes [10]. FDA guidance continues to focus on weight loss as the primary efficacy endpoint but acknowledges the limitations of weight alone [11]. Both sets of recommendations are directed at Phase 3, registration‑oriented trials intended for marketing authorisation. Taken together, these frameworks reflect a broader regulatory interest in understanding changes beyond body weight, which may strengthen submissions and support differentiation in a competitive market.
Conclusion: Tailored insights for confident decisions and market differentiation
In today’s competitive obesity drug landscape, robust evidence is essential. At Antaros Medical, we help you uncover the full picture of weight loss by showing how your therapy impacts fat, muscle, and key metabolic organs such as the liver, kidney, and heart.
Our solutions span from high-throughput DXA for large-scale studies to advanced MRI for detailed body and muscle composition analysis. For deeper metabolic insights, we use MRS to assess muscle lipid content and mitochondrial function, and PET to measure substrate use and insulin sensitivity.
Our expertise ensures you generate insights that matter – supporting confident decision-making, regulatory success, and clear market differentiation.
References
[1] Shulman GI. Ectopic Fat in Insulin Resistance, Dyslipidemia, and Cardiometabolic Disease. N. Engl. J. Med. 2010.
[2] Britton KA, Fox CS. Ectopic Fat Depots and Cardiovascular Disease. Circulation. 2011;124:1177–1184.
[3] Raphael H, Klang E, Konen E, et al. Renal Fat Accumulation Assessed by MRI or CT and Its Association with Clinical and Metabolic Disorders: A Systematic Imaging Review. J. Clin. Med. 2025;14(12):4305.
[4] Jones HG, Kopinke D, Meyer GA. Intramuscular adipose tissue: from progenitor to pathology. Am. J. Physiol. Cell Physiol. 2025;329(4):C1268–C1282. doi:10.1152/ajpcell.00613.2025.
[5] Krssak M, Falk Petersen K, Dresner A, et al. Intramyocellular lipid concentrations are correlated with insulin sensitivity in humans: a 1H NMR spectroscopy study. Diabetologia. 1999;42:113–116.
[6] Azhar M, Watson LPE, De Lucia Rolfe E, et al. Association of insulin resistance with the accumulation of saturated intramyocellular lipid: A comparison with other fat stores. NMR Biomed. 2024;e5117.
[7] Kupriyanova Y, Schrauwen-Hinderling V. Advances in in vivo magnetic resonance spectroscopy for metabolic disorders. Front. Endocrinol. 2025;16:1578333.
[8] Qaed E, Wang J, Almoiliqy M, et al. Phosphocreatine Improves Cardiac Dysfunction by Normalizing Mitochondrial Respiratory Function through the JAK2/STAT3 Signaling Pathway In Vivo and In Vitro. Oxid. Med. Cell. Longev. 2019.
[9] Laitinen I, Litorp H, Sjöberg F, et al. Tissue-specific and whole-body insulin sensitivity by integrated imaging and hyperinsulinemic euglycemic clamp: A repeatability study in people with T2DM and overweight/obesity. EJNMMI Res. 2025;15:105.
[10] European Medicines Agency (EMA). Guideline on clinical evaluation of medicinal products used in weight control / weight management. EMA/CHMP/311805/2014. Effective 1 January 2017.
[11] Food and Drug Administration (FDA). Obesity and Overweight: Developing Drugs and Biological Products for Weight Reduction. Draft Guidance for Industry. January 2025, Revision 2.