From staging to understanding fibrosis: Advancing drug development with imaging biomarkers
By Olof Eriksson, CSO at Antaros Tracer & Lars Johansson CSO at Antaros Medical Published: 21 OCT 2026
Fibrosis and fibrogenesis remain important therapeutic targets across liver, kidney, lung and cardiovascular disease, yet evaluating treatment effects in clinical trials remains challenging. Fibrosis burden reflects damage accumulated over time and is useful for disease staging but may change too slowly to provide an indication of therapeutic response within a clinical trial.
Providing complementary measures of fibrosis burden, inflammation and active fibrogenesis, imaging biomarkers can reveal how different aspects of fibrotic disease change with time or treatment, moving fibrosis assessment beyond staging towards a more complete evaluation of treatment response.
Development of fibrosis, the gradual replacement of normal parenchyma with connective scar tissue, is a common end-stage across many diseases and organs. While the exact cell types and processes involved vary from organ to organ, the common mediator of fibrosis is the myofibroblast, which, once activated, serves as the primary source of collagen production. Activated myofibroblasts produce and deposit extracellular matrix (ECM) which accumulates and replaces the normal parenchyma with connective tissue. While the principles discussed apply across fibrotic diseases, liver fibrosis is used as the main example throughout this article.
Scoring, staging and grading fibrosis: The limitations of histology
Historically, histology has been considered the ‘gold standard’ for assessing inflammation (‘grade’) and fibrosis (‘stage’) in organs like the liver and kidney. Several scoring systems have been developed and proposed over the years for use in liver disease, but the most widely used in clinical trials is the NASH Clinical Research Network (NASH-CRN) system. The system combines steatosis grade with degree of lobular inflammation and hepatocellular ballooning into an activity score and categorizes fibrosis stage.
Histological assessment of inflammation and fibrosis using tissue biopsy has several important limitations, which are well established and documented. The biopsy procedure is invasive, resource-intensive and costly, and carries risk of complications. There is also risk of sampling error given heterogeneity in the liver, as well as susceptibility to intra- and interobserver variability.
This has given rise to the need for alternative methods, non-invasive tests (NITs), which can be categorized broadly into circulating panels, liver stiffness measurements and imaging modalities such as magnetic resonance imaging (MRI) and positron emission tomography (PET) (See Figure 1).
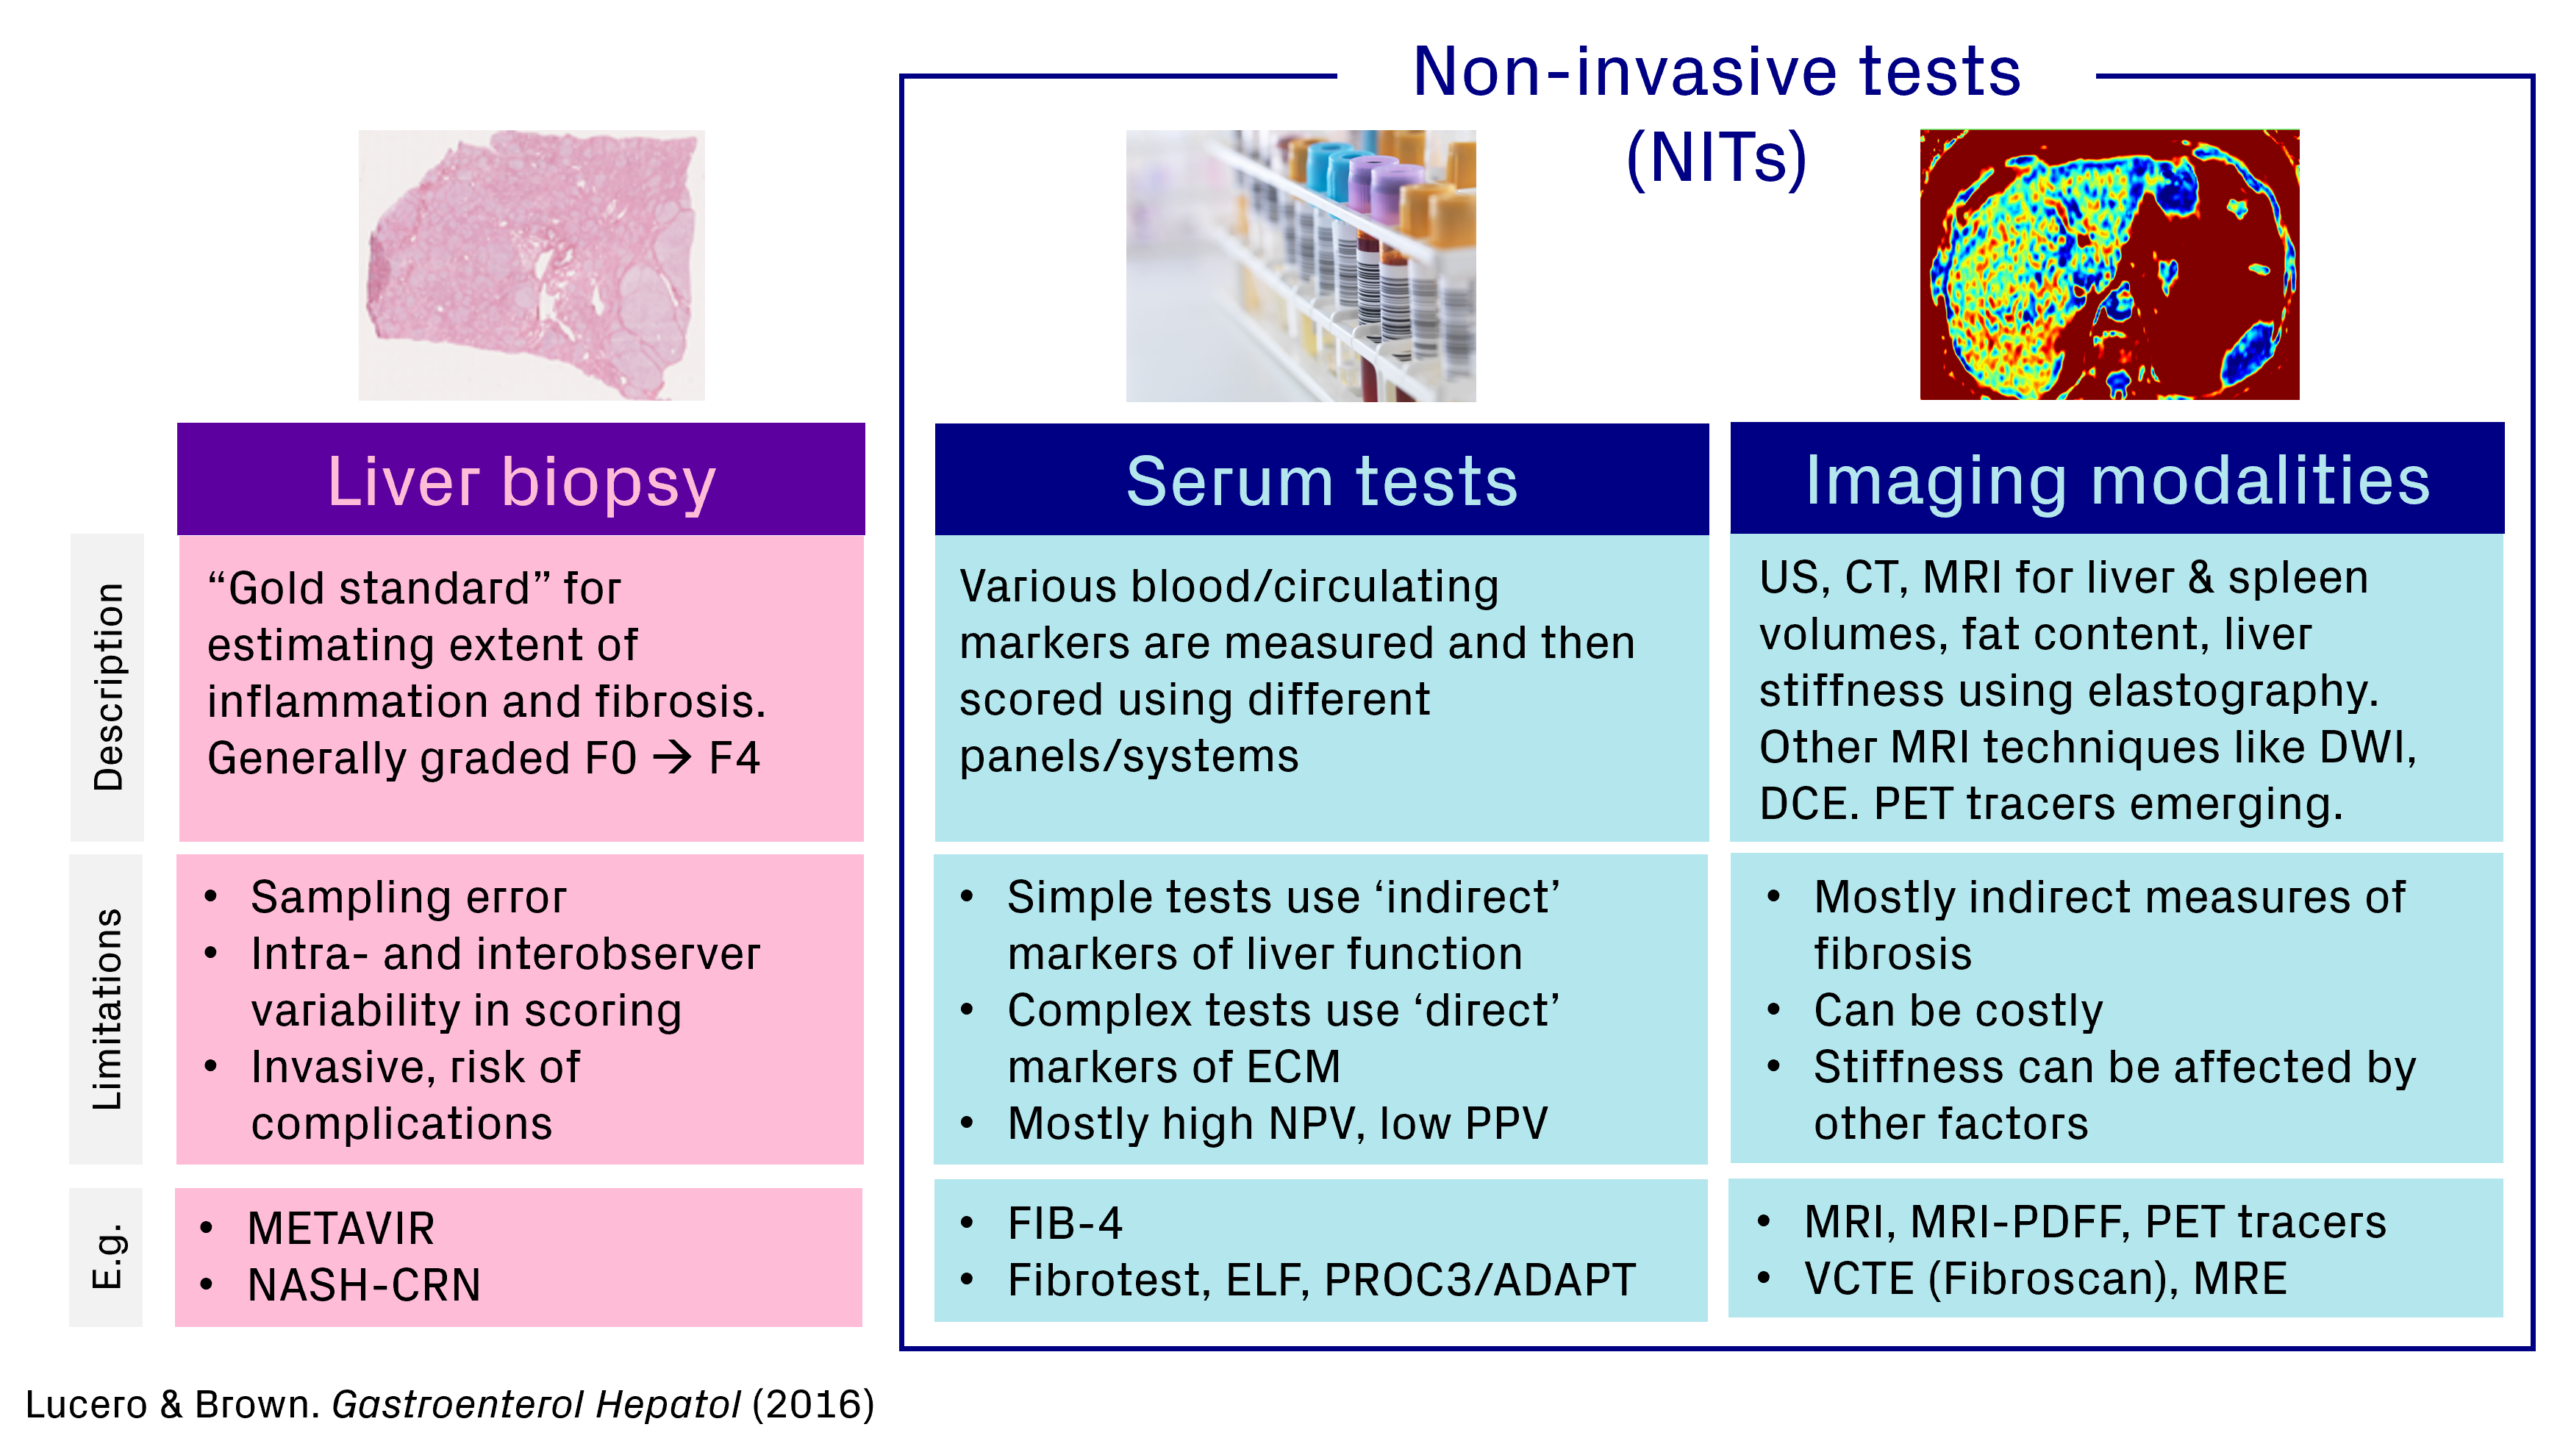
Figure 1: Categories of non-invasive tests that can be used in liver disease clinical trials, including serum tests, imaging techniques and liver stiffness measurements
Measuring stiffness with elastography
Liver stiffness can be measured using elastography with ultrasound (vibration-controlled transient elastography; VCTE; FibroScan) or magnetic resonance (MRE). The key advantages of MRE are that it analyses the whole liver while VCTE samples only a small, localized area, and that MRE has higher accuracy and reproducibility. MRE combines MRI with low-frequency vibrations to measure the stiffness, which is highly correlated with the amount of fibrosis or the ‘fibrosis burden’ (See Figure 2), especially with advanced fibrosis or cirrhosis.
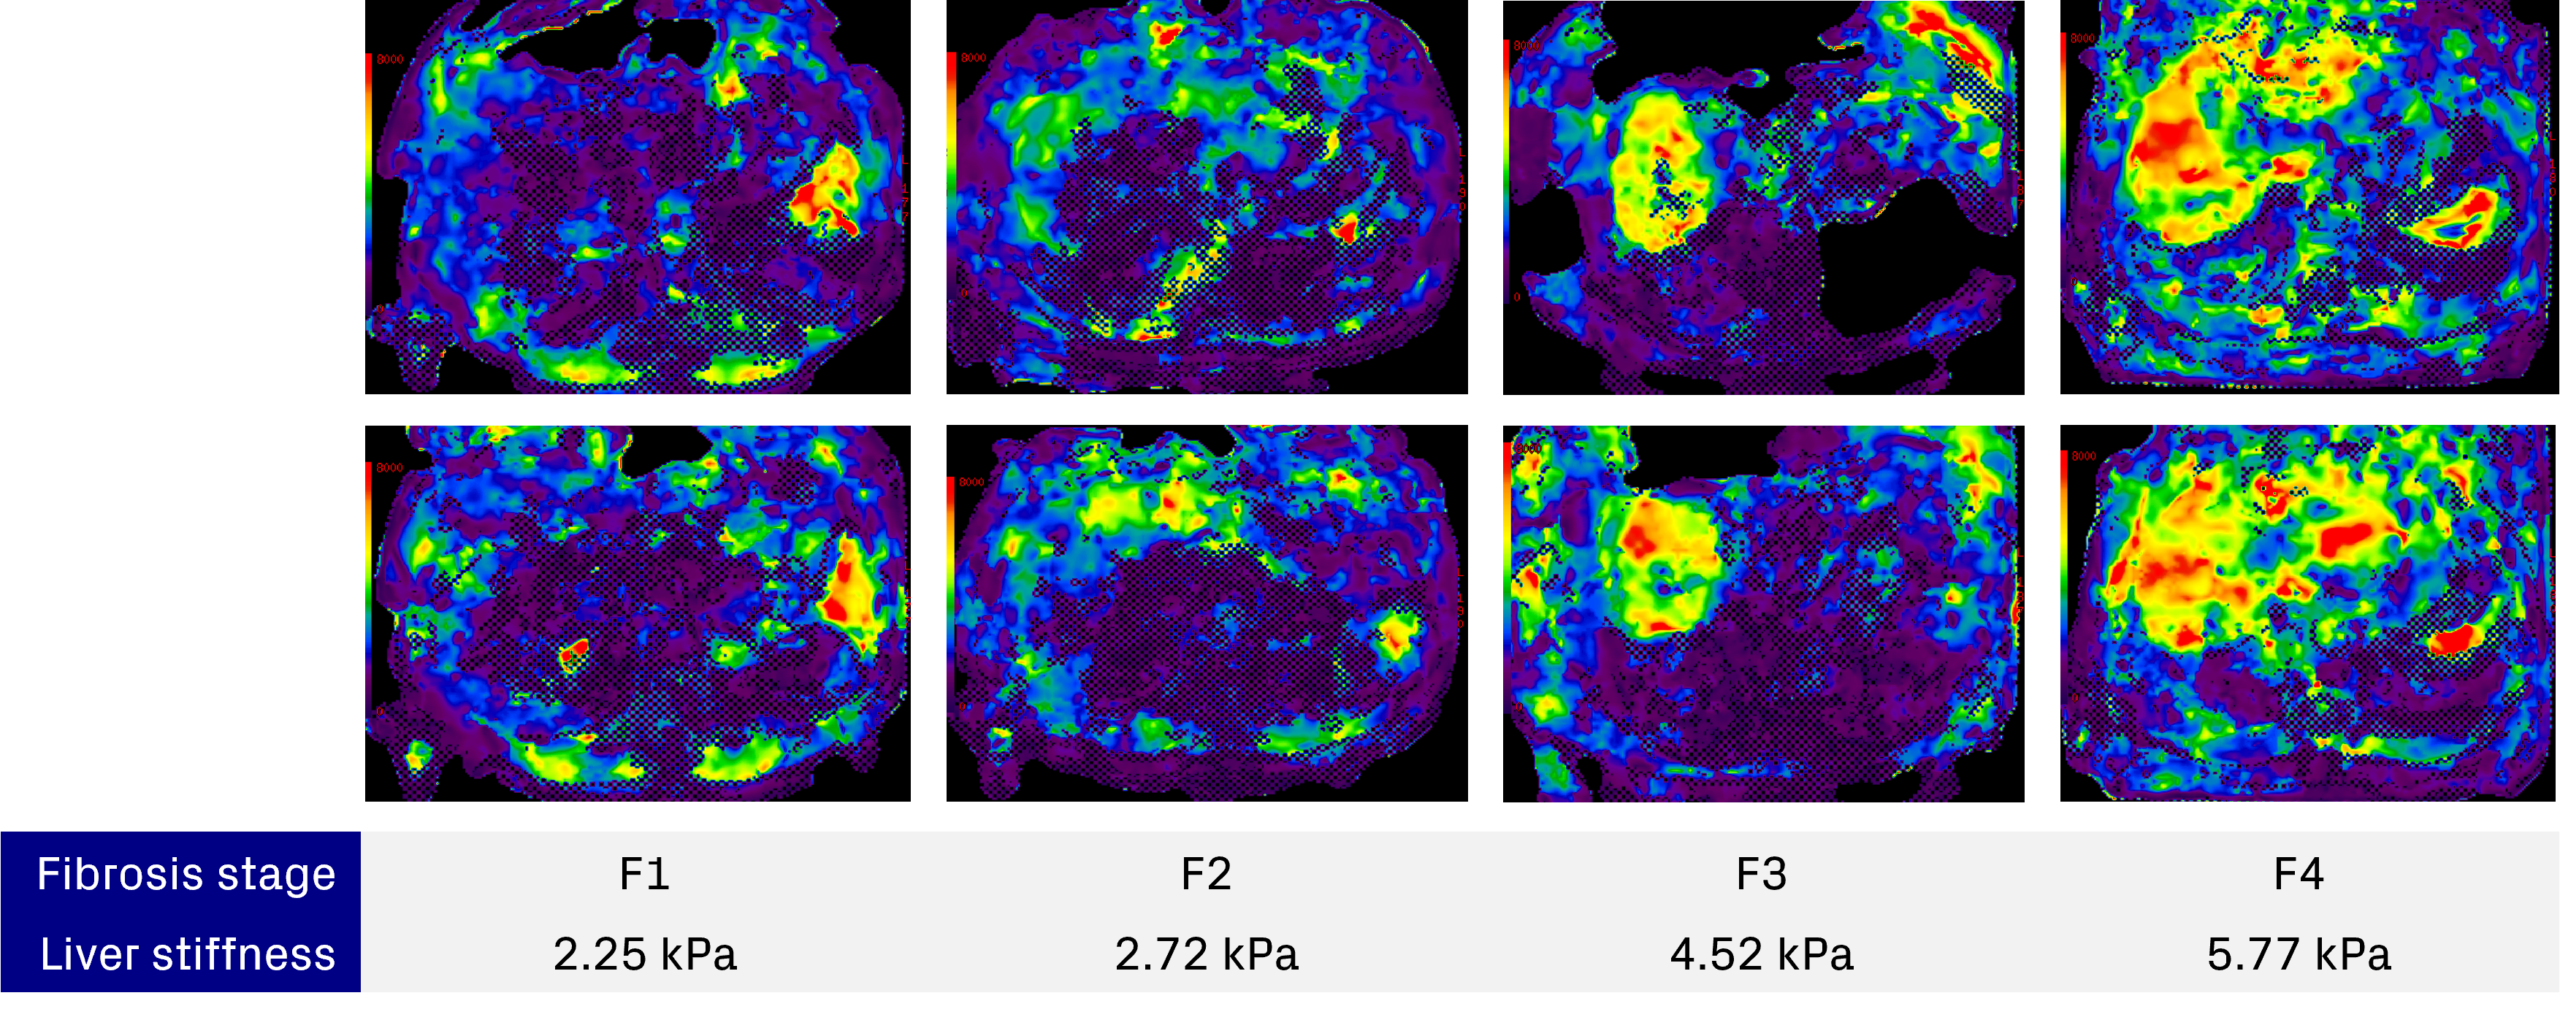
Figure 2: Data from Antaros Medical’s internal MASH (formerly NASH) imaging biomarker study
There are also composite scoring systems that combine measures of different modalities, such as the MAST score, which combines MRI-proton density fat fraction (MRI-PDFF), MRE and aspartate aminotransferase (AST) levels. While these approaches help quantify the extent of fibrosis, they provide limited information about the biological processes that are actively driving disease progression.
Detangling inflammation and fibrosis with PET imaging
Positron emission tomography (PET) offers the possibility to untangle and measure different aspects of inflammation and fibrosis using novel tracers (See Figure 3):
- Fibrogenesis: markers of the deposition of new fibrotic components, like platelet-derived growth factor receptor beta (PDGFRβ) which is upregulated in activated hepatic stellate cells. PDGFRβ-targeted PET offers the potential to quantify active fibrotic disease. This is explored further below.
- Early inflammation: markers of early inflammatory processes, such as cluster of differentiation 69 (CD69), which is a general surface marker for activated immune cells, especially in the early activation process, though may be better suited in fibrosis in other organs besides the liver. A PET tracer for CD69 is in clinical development for quantitative, non-invasive assessment of inflammatory processes. This could be especially relevant for the concept of hot and cold forms of fibrosis, where ‘hot’ fibrosis describes an inflammatory state with lots of immune cell activity, and ‘cold’ fibrosis refers to fibrosis with less inflammatory activity.
- Fibrosis deposition: markers of fibrotic tissue, such as collagen type 1, which is the main structural protein that builds up during the formation of fibrosis. A PET tracer for collagen-1 offers the potential to directly and quantitatively assess fibrosis stage.
- Fibrolysis: markers of the breakdown of existing scar tissue can signal reversal or even resolution of fibrosis. There is evidence showing that liver fibrosis is reversible. This has been shown, for example, in both bariatric surgery and with antiviral treatment for hepatitis C virus (HCV), where there can be significant effects if the cause of the injury.
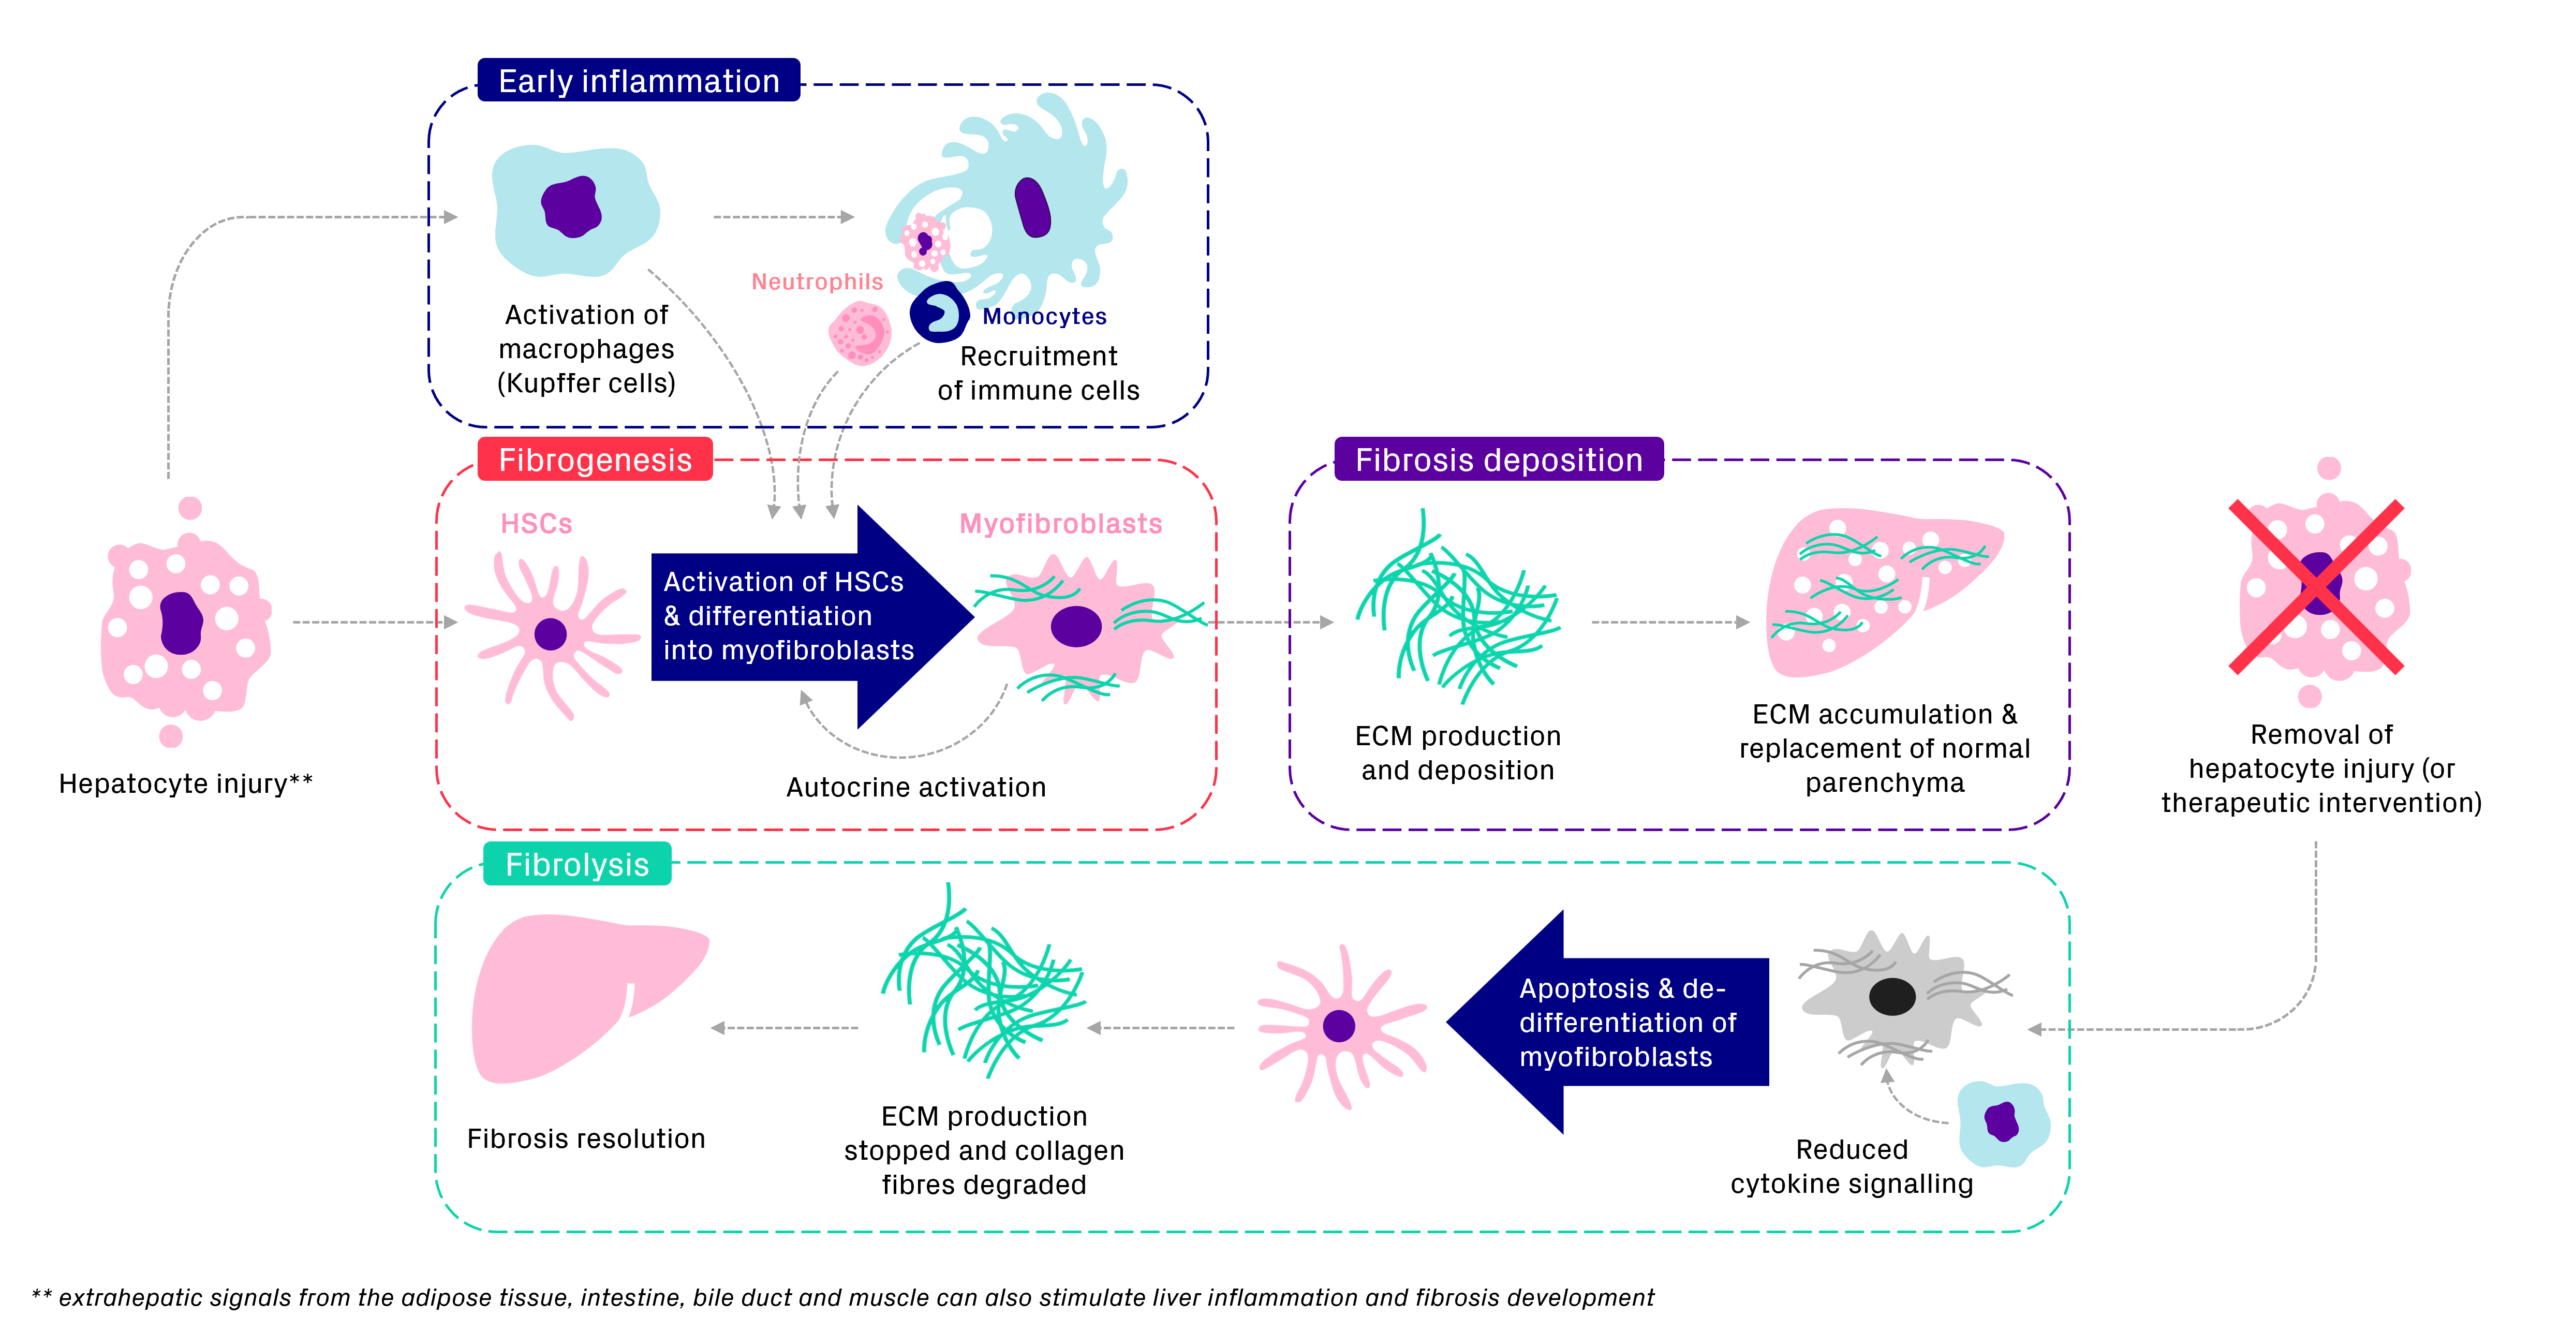
Figure 3: Processes involved in development of fibrosis and some PET tracers available to image them
Fibrosis: A balance between fibrogenesis and fibrolysis
Fibrosis accumulates when the rate of deposition of new fibrotic components (fibrogenesis) exceeds that of the degradation of existing fibrosis (fibrolysis). This means that the metaphorical filling of the bathtub can be due to either upregulated fibrogenesis or insufficient fibrolysis (See Figure 4). Measuring fibrosis burden is important for staging disease severity, but it provides only a snapshot of disease and will not give any information about the underlying causes, rate of progression, or which processes are best targeted with treatment. Patients can have similar levels of fibrosis burden with very different levels of ongoing fibrogenic activity.
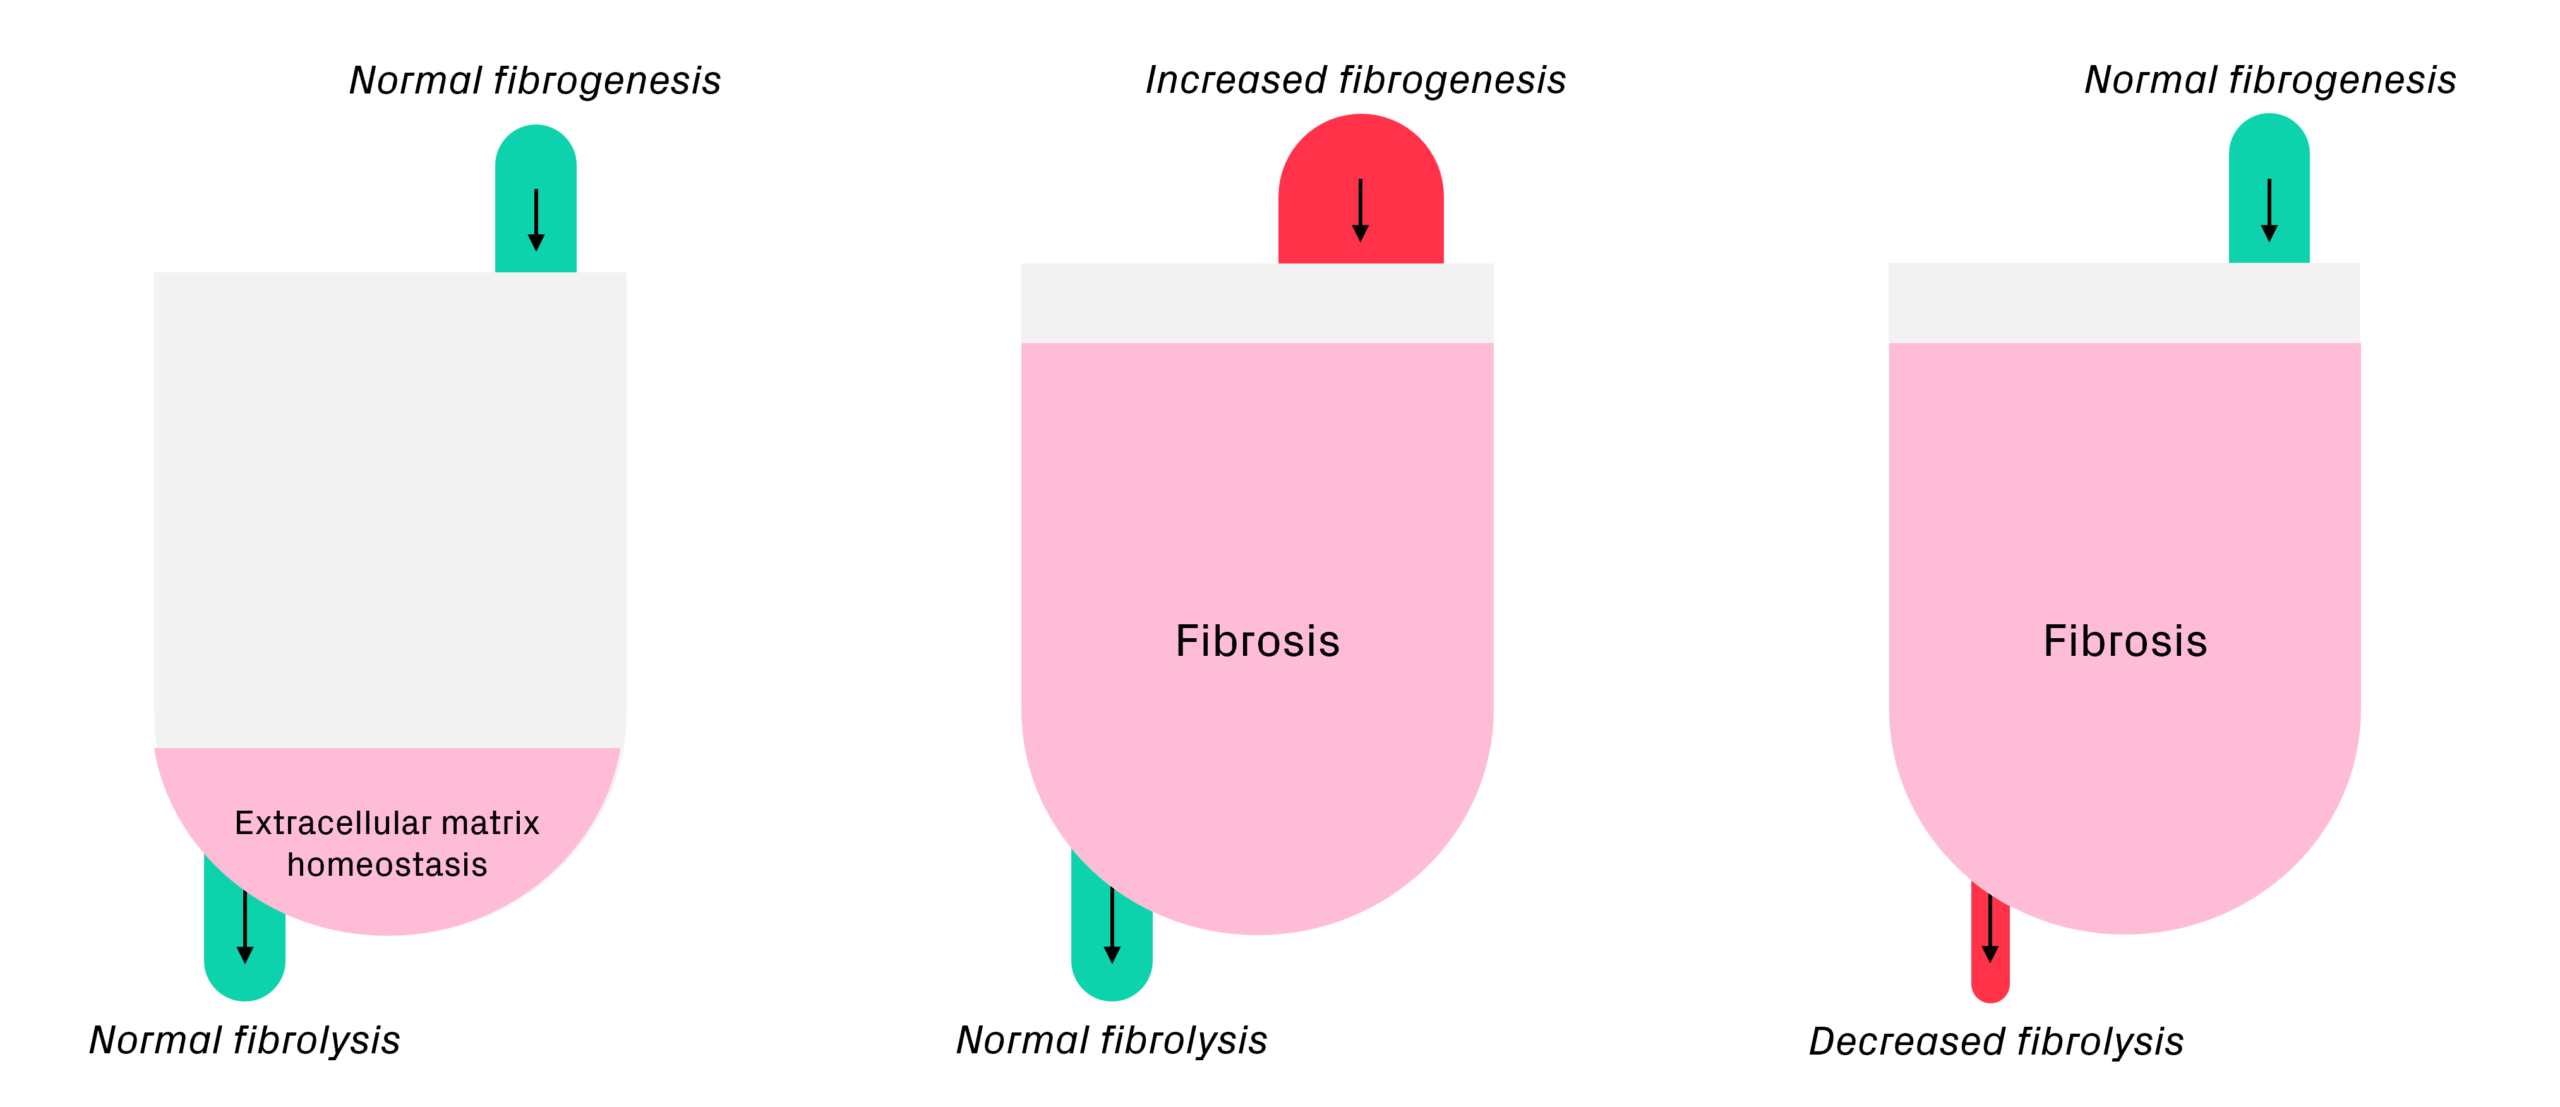
Figure 4: Fibrosis accumulates when there is imbalance between fibrogenesis and fibrolysis. Modified from Eriksson & Velikyan, Pharmaceuticals (2023).
One example of this is shown in Figure 5, where three participants with advanced chronic liver disease (ACLD) and fibrosis stage 4 (F4) have different levels of fibrogenic activity as measured with PDGFRβ PET imaging. ATH001 is a radiopharmaceutical PET tracer being developed to target PDGFRβ, a marker of ongoing fibrogenesis that is upregulated in activated hepatic stellate cells, enabling tissue-specific quantification of active fibrotic disease.
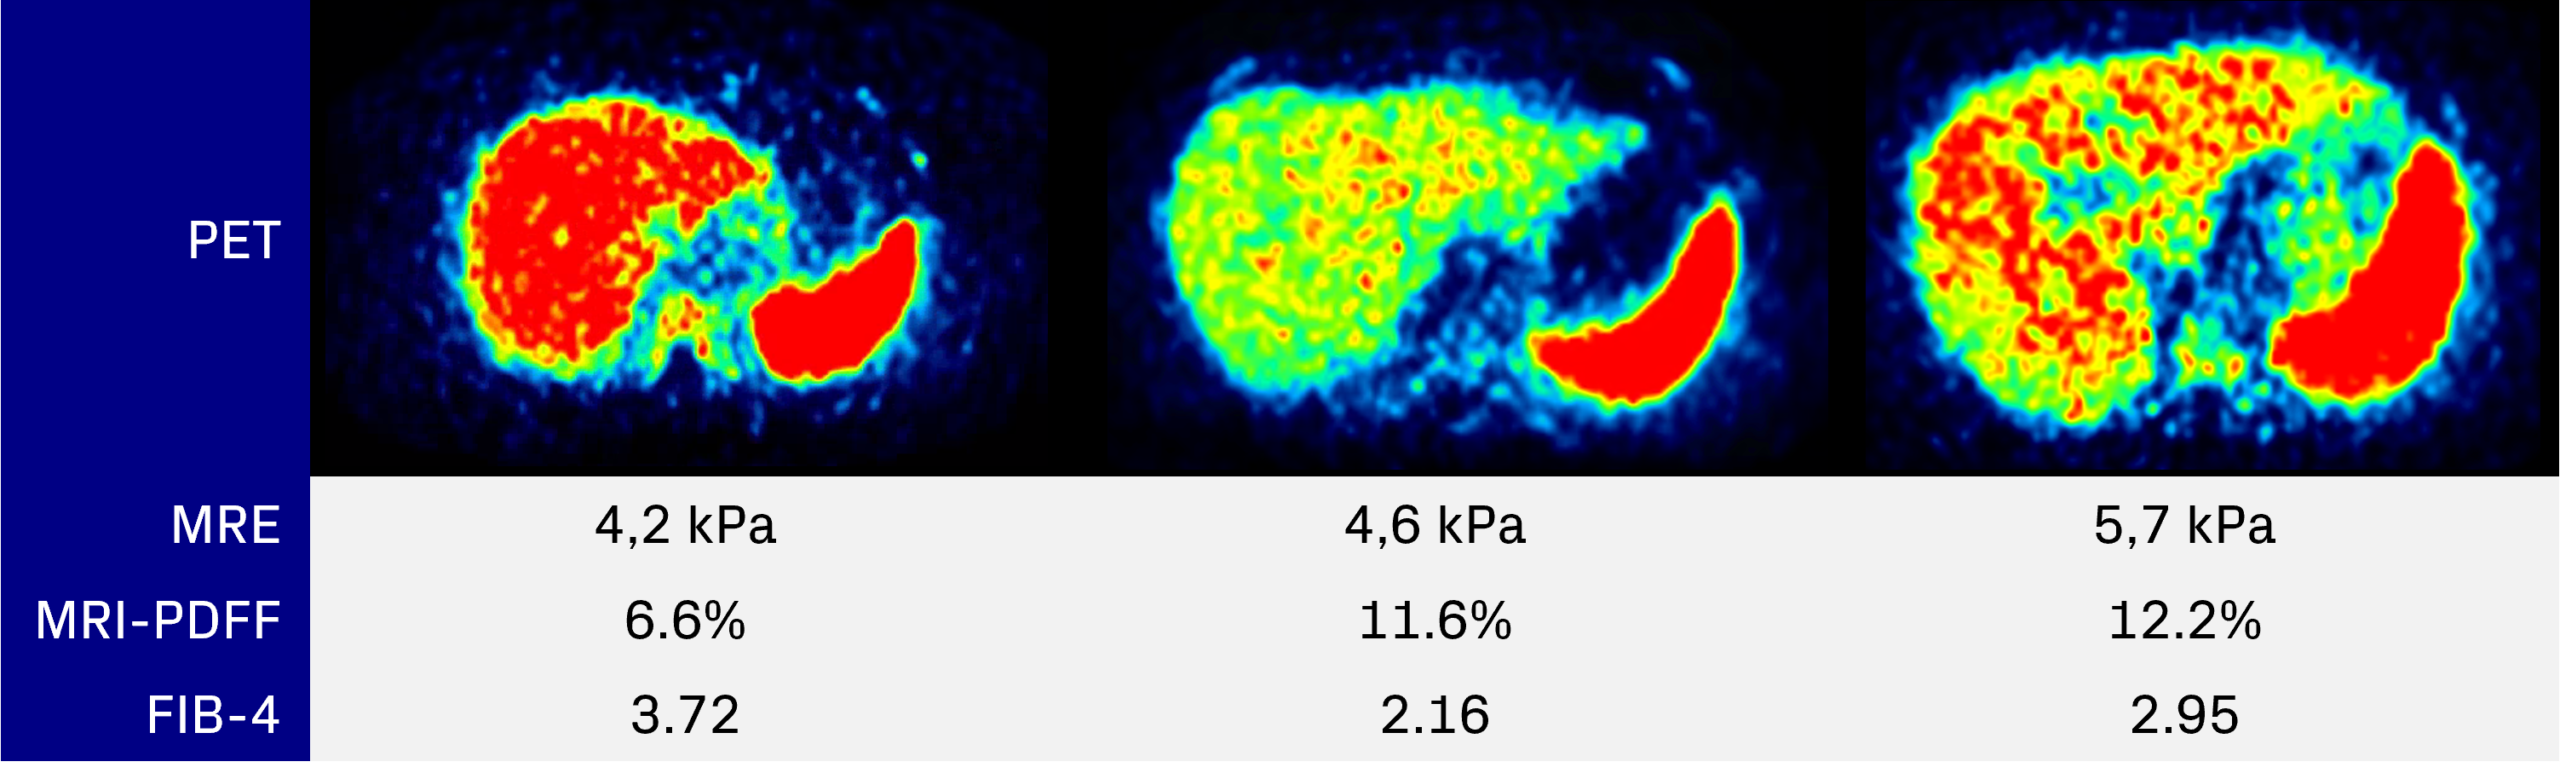
Figure 5: PET images, and MRE, MRI-PDFF and FIB-4 values for 3 participants with F4 advanced chronic liver disease.
Detecting changes in fibrosis during clinical trials
Assessing changes in fibrosis is central to drug development across liver, kidney, lung and cardiovascular disease, yet no single method captures all aspects of fibrotic disease or treatment response. Structural and molecular imaging methods can therefore be combined to provide complementary information.
Fibrolysis is a complex and often slow process, meaning that measurable changes in fibrosis burden may be difficult to detect within the duration of a clinical trial. An alternative to measuring fibrosis burden alone is to complement it with biomarkers of active fibrogenesis, such as PDGFRβ PET. Because changes in active fibrogenesis may precede measurable changes in accumulated fibrosis burden, this approach has the potential to provide an earlier indication of biological response to treatment.
The right combination of methods for assessing fibrosis will depend on the disease and its severity, the patient population, drug mechanism of action, trial design and duration, and ultimately the research question to be answered regarding fibrosis. Aligning imaging biomarkers with these factors can provide an earlier indication of biological efficacy and a more complete assessment of how fibrosis burden and active disease processes change with treatment, supporting more informed decisions as the clinical programme progresses.